TRX Gold Reports Robust PEA on Next Buckreef Gold Expansion
Pre-tax NPV5% of US$701M at US$2,296/oz
Increasing to US$1.2Bn at US$3,000/oz
TORONTO, April 22, 2025 (GLOBE NEWSWIRE) — TRX Gold Corporation (TSX: TRX) (NYSE American: TRX) (the “Company” or “TRX Gold”) is pleased to announce positive results of a Preliminary Economic Assessment (the “PEA”) on the expansion of its Buckreef Gold Project (“Buckreef Gold”) in Tanzania. The PEA evaluated the following scenario: (i) an expansion and upgrade of the existing process plant at Buckreef Gold to 3,000 tonnes per day (“tpd”); and (ii) a transition from open pit mining to underground mining over the next 2-3 years. The PEA will be filed under the Company’s profile on SEDAR+ within 45 days of this announcement.
Stephen Mullowney, TRX Gold CEO commented: “We have taken what we have learned over the past couple of years and have now provided a more in-depth roadmap of Buckreef Gold’s potential based on what is currently known, with a keen focus on maximizing the economics of Buckreef Gold. This PEA yields positive results based on a relatively straightforward expansion, similar to the expansions we have successfully completed previously. The PEA and associated project economics can also be further enhanced by additional process plant capacity and mining rate increases in the future, and the Company will now begin to evaluate these opportunities. The PEA does not currently contemplate inclusion of any new exploration discoveries at Buckreef Gold. The Anfield Zone has not been included and only a small portion of Stamford Bridge Zone has been reflected in this PEA. This is our first insight into Stamford Bridge, and it is still early days there as we continue to execute our exploration program across the entire Buckreef Gold concession. The future is looking bright, and we are well on our way towards making Buckreef Gold an exceptional gold producing asset.”
The Key Outcomes of the PEA:
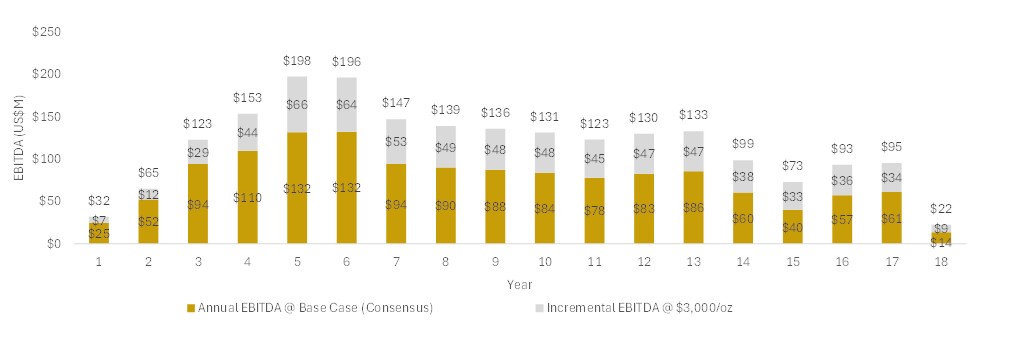
- Base case NPV5% of US$701.0 million pre-tax, or US$442.2 million after tax at consensus forecast case gold prices (US$2,707/oz year 1, US$2,646/oz year 2, US$2,495/oz year 3, US$2,400/oz year 4, US$2,245/oz thereafter) and NPV5% of US$1,180.5 million pre-tax, or US$766.4 million after tax at an upside US$3,000/oz gold price;
- The PEA demonstrates the Company’s ability to potentially finance the expansion from internally generated cash flow without an upfront capital requirement, thus there is no quoted Internal Rate of Return;
- Over a 17.6-year period, the total process plant throughput is expected to be 18.1 million tonnes averaging 2.14 g/t Au with average recovered gold production of approximately 62,000 oz Au per annum. During the first five years of the underground operation, average recovered production is planned to be over 80,000 oz Au per annum;
- Life of Mine (“LOM”) cash costs average US$1,024/oz Au and all-in sustaining costs (“AISC”) average of US$1,206/oz Au;
- Growth capital of US$89 million will be deployed over the next four-year period comprised of: (i) US$55 million in capital for the underground expansion; (ii) US$30 million for process improvements, process plant throughput expansion, and camp upgrades; and (iii) US$3 million for tailings facility upgrades. LOM growth capital is estimated to be US$175 million and is primarily for underground development. LOM sustaining capital cost of US$87 million is estimated for site and process plant, and US$97 million for underground mining;
- The PEA mine plan was developed from Measured and Indicated Mineral Resources of 10.8 million tonnes (“Mt”) grading 2.57 grams per tonne (“g/t”) gold containing 893,000 ounces of gold and Inferred Mineral Resources of 9.1 Mt grading 2.47 g/t gold containing 726,000 ounces of gold; and
- With the existing open pit mine operating, the underground expansion plan benefits from the existing on-site process plant and mine infrastructure in place. The Company anticipates gold production from the underground expansion could be achieved within 3 years.
The PEA is preliminary in nature and includes Inferred Mineral Resources that are considered too speculative geologically to enable them to be categorized as Mineral Reserves. Therefore, there is no certainty that the PEA economics will be realized. Mineral Resources that are not Mineral Reserves may not have demonstrated economic viability. The Company engaged P&E Mining Consultants Inc. (“P&E”) to complete an updated Mineral Resource Estimate for Buckreef Gold (Table 8) which provides the Mineral Resource basis for the PEA, and expansion of the mine to include underground production, and for the existing process plant to increase capacity to approximately 3,000 tpd.
Stephen Mullowney, TRX Gold CEO, further states, “The results of the PEA, as summarised in Table 1, show an extremely robust project capable of producing 1.1 million gold ounces over a 17.6-year life, with low cash costs of only US$1,024/oz Au and AISC of US$1,206/oz Au. The PEA indicates an upside pre-tax NPV5% of US$1.2 billion and after-tax NPV5% of US$766 million at US$3,000/oz gold. We will now start work on optimizing results further, including evaluating an additional process plant expansion and increased mining rates. We believe that will help to solidify a project which ultimately is capable of producing 100,000+ gold ounces per year for 10+ years, based on what is currently known and excluding any new additional Mineral Resources. It should be noted that Mineral Resources were also estimated at a US$1,900 per oz gold price and there is also the potential to add additional economic material if gold prices remain at current levels.
The growth capital cost for the expansion is estimated at US$89 million over a four-year period, inclusive of a process plant expansion, process improvements, and tailings facility upgrades. The Company has already commenced some preparatory work for this expansion, including capital expenditure for the process plant upgrades and camp expansion.
In addition, TRX Gold has established a strong Operations team of mining professionals on the ground in Tanzania, which has successfully managed Buckreef Gold’s three previous expansions on-time and on-budget, in achieving the current 2,000 tpd throughput capacity. The Company has been further enhancing the skillset of this team to ensure that the necessary personnel are in place to support the next step in the development of Buckreef Gold.”
Based on the estimated production schedule, capital costs and operating costs, a cash flow model was prepared by TRX Gold for the economic analysis of the Buckreef Project. The cash flow model was reviewed and approved by P&E. All information used in this economic evaluation was derived from work completed by P&E, with support by TRX Gold.
Project economics were evaluated using a discounted cash flow method that measures the before-tax and after-tax Net Present Value (“NPV”) of future cash flow streams. The PEA economic model was based on the following key assumptions in Table 1.
Table 1 – PEA Summary of LOM 25 Key Metrics and Project Economics
| Summary of Project Economics | Life of Mine | |
| Base Case Gold Price | US$ | 2,707/oz year 1; 2,646/oz year 2; 2,495/oz year 3; 2,400/oz year 4; and 2,245/oz thereafter |
| Discount Rate | % | 5 |
| Mining Parameters | ||
| Open Pit – Tonnes of Mineralization | Mt | 3.5 |
| Open Pit – Avg Grade | g/t Au | 1.92 |
| Open Pit – Strip Ratio | w:o | 6.0 |
| Underground – Tonnes of Mineralization | Mt | 14.4 |
| Underground – Avg Grade | g/t Au | 2.22 |
| Mine life – Open Pit & Underground | Years | 17.6 |
| Process Plant Parameters | ||
| Recovery | % | 87 |
| Rate | tpd | 2,824 |
| Total Tonnage Processed | Mt | 18.1 |
| Average Annual Production | oz/year | 61,700 |
| Average Annual Production (first five years of underground) | oz/year | 80,100 |
| Capital Expenditures | ||
| Initial Capital Expenditures | US$M | Nil |
| Growth Capital Expenditure | US$M | 174.5 |
| Sustaining Capital Expenditure | US$M | 184.4 |
| Closure Cost | US$M | 13.4 |
| Operating Costs | ||
| Mining Cost – Open Pit | US$/t mined | 3.78 |
| Mining Cost – Underground | US$/t processed | 33.09 |
| Processing Cost | US$/t processed | 12.68 |
| G&A cost | US$/t processed | 6.50 |
| Cost per Ounce | ||
| LOM Cash Cost | US$/oz | 1,024 |
| LOM All-in Sustaining Cost | US$/oz | 1,206 |
| Financial Analysis | ||
| Pre-tax NPV 5% | US$M | 701.0 |
| Post-tax NPV 5% | US$M | 442.2 |
Financial Analysis
Figure 1 – Annual After-Tax Free Cash Flow (US$ millions), Cash Cost and AISC (US$/oz)

Figure 2 – Annual EBITDA (US$ millions)
Sensitivities
Table 2 – PEA Sensitivity Analysis – Gold Price
| Gold Price (US$/oz) | Pre-tax NPV 5% (US$M) | Post-tax NPV 5% (US$M) | |
| $3,000 | 1,180.5 | 766.4 | |
| $2,800 | 1,040.9 | 672.0 | |
| Base Case (avg. $2,296) | 701.0 | 442.2 | |
| $2,400 | 761.6 | 483.1 | |
| $2,200 | 622.0 | 388.7 | |
| $2,000 | 482.4 | 294.2 | |
| $1,800 | 342.8 | 199.3 | |
Table 3 – PEA Sensitivity Analysis – Operating Costs
| Pre-tax NPV 5% (US$M) | Post-tax NPV 5% (US$M) | |||
| Operation Cost | Base Case (avg. US$2,296) | Upside Case @ US$3,000 | Base Case (avg. US$2,296) | Upside Case @ US$3,000 |
| Base case -25% | 858.9 | 1,338.3 | 552.6 | 876.9 |
| Base case -10% | 764.2 | 1,243.6 | 486.4 | 810.6 |
| Base case 0% | 701.0 | 1,180.5 | 442.2 | 766.4 |
| Base case +10% | 637.9 | 1,117.3 | 398.0 | 722.2 |
| Base case +25% | 543.2 | 1,022.6 | 331.6 | 656.0 |
Table 4 – PEA Sensitivity Analysis – Growth Capital Costs
| Pre-tax NPV (US$M) | Post-tax NPV (US$M) | |||
| Growth Capital Cost | Base Case (avg. US$2,296) | Upside Case @ US$3,000 | Base Case (avg. US$2,296) | Upside Case @ US$3,000 |
| Base case -25% | 735.9 | 1,215.4 | 468.7 | 792.9 |
| Base case -10% | 715.0 | 1,194.4 | 452.8 | 777.0 |
| Base case 0% | 701.0 | 1,180.5 | 442.2 | 766.4 |
| Base case +10% | 687.1 | 1,166.5 | 431.6 | 755.8 |
| Base case +25% | 666.2 | 1,145.6 | 415.6 | 739.9 |
Production
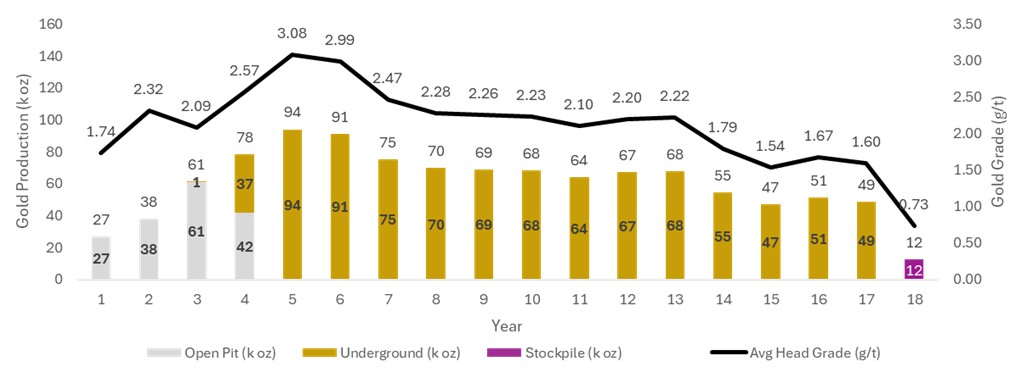
Annual production over LOM is expected to average approximately 62,000 ounces with peak production of 94,000 ounces in year 5 (Figure 3). Underground production commences in Year 3.
Figure 3 – Production Profile
Capital Expenditures
The growth capital expenditures are estimated at US$89 million in Years 1 to 4. LOM growth capital expenditures are estimated at US$175 million and the sustaining capital expenditures are estimated at US$184 million (Tables 5 & 6). A contingency of US$23 million and US$19 million is included in growth and sustaining capital expenditures, respectively.
Growth and sustaining capital expenditures were estimated based on current costs received from vendors as well as developed from first principles, while some were estimated based on factored references and experience from similar operating projects.
Figure 4 – Capital Expenditure Profile (US$ millions)
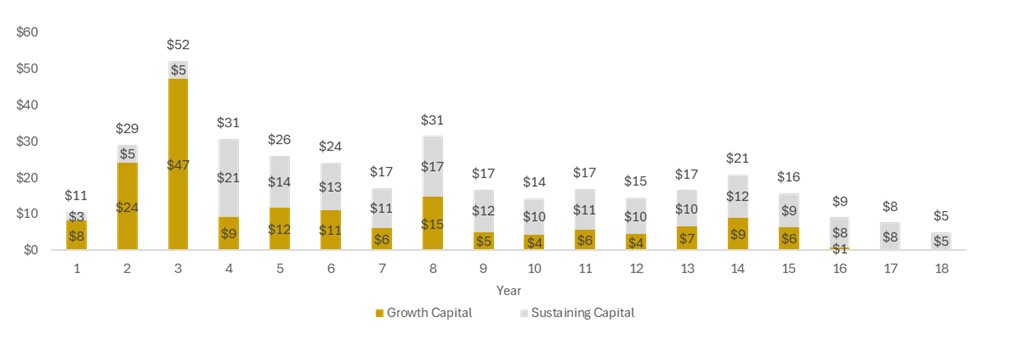
Table 5 – Growth Capital Expenditures (US$ millions)
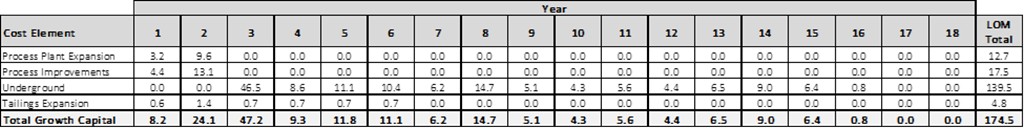
Table 6 – Sustaining Capital Expenditures (US$ millions)
| Cost Element | LOM Total |
| Site and Process Plant – US$5M per year | 87.5 |
| Underground | 96.9 |
| Total Sustaining Capital | 184.4 |
Total Cash Costs
The total unit cash costs are estimated at US$1,024/oz. The AISC is estimated at US$1,206/oz. Operating cost estimates were developed using first principles methodology, vendor quotes, and based on historical actual operating information at Buckreef Gold.
Table 7 – Total Cash Cost and AISC
| Cost Element | LOM Total (US$M) | Average LOM (US$/tonne processed) | Average LOM (US$/oz) | |
| Mining (Open Pit) | 91.7 | 26.6 (1) | 84.5 | |
| Mining (Underground) | 475.0 | 33.1 (2) | 437.7 | |
| Processing | 229.2 | 12.7 | 211.2 | |
| General & Admin. | 117.5 | 6.5 | 108.3 | |
| Royalty & Selling Cost | 197.5 | 10.9 | 182.0 | |
| Total Cash Cost | 1,110.8 | 61.4 | 1,023.7 | |
| Sustaining Capital | 184.4 | 10.2 | 169.9 | |
| Reclamation | 13.4 | 0.7 | 12.4 | |
| Total AISC | 1,308.7 | 72.4 | 1,206.0 | |
Notes:
(1) Per tonne of ore processed from open pit only.
(2) Per tonne of ore processed from underground only.
Mineral Resource Estimate
An updated Mineral Resource Estimate for Buckreef Gold including the Stamford Bridge domain is presented in Table 8 and has an effective date of April 15, 2025.
Mineral Resource Estimate Methodology
The Buckreef Gold and Stamford Bridge Mineral Resource models were developed by P&E from 135 wireframes and one respective wireframe, all created by P&E over respective 2.2 km and 155 m strike lengths. Buckreef Gold utilized 884 drill holes while Stamford Bridge utilized eight. Wireframes were developed from an open pit cut-off of 0.40 g/t Au while underground was 1.20 g/t Au. Both Mineral Resource models utilized 1.0 m capped composites ranging from no capping to 60 g/t Au. Block models were set up with 2.5 m x 5.0 m x 5.0 m blocks rotated 30 degrees clockwise and used a bulk density of 2.70 t/m3. Grade interpolation was done with inverse distance cubed estimation. Based on variography, Measured Mineral Resources were those blocks classified within 20 m of three drill holes while Indicated Mineral Resources were classified within 40 m of three drill holes. All other wireframe constrained grade blocks were classified as Inferred Mineral Resources. Pit-constrained and out-of-pit Mineral Resources were reported above respective 0.42 g/t and 1.31 g/t Au cut-offs.
Table 8 – Mineral Resource Estimate (1-7)
| Zone | Cut-off Au g/t | Tonnes (k) | Au g/t | Au ozs (k) |
| MAIN | ||||
| Measured | 0.42/1.31 | 2,982.8 | 2.36 | 226.4 |
| Indicated | 0.42/1.31 | 6,193.9 | 2.72 | 542.6 |
| Meas + Ind | 0.42/1.31 | 9,176.7 | 2.61 | 769.0 |
| Inferred | 0.42/1.31 | 7,549.3 | 2.37 | 576.0 |
| SOUTH | ||||
| Measured | 0.42/1.31 | 23.6 | 1.68 | 1.3 |
| Indicated | 0.42/1.31 | 35.3 | 1.95 | 2.2 |
| Meas + Ind | 0.42/1.31 | 58.9 | 1.84 | 3.5 |
| Inferred | 0.42/1.31 | 53.8 | 1.70 | 2.9 |
| WEST | ||||
| Measured | 0.42/1.31 | 40.3 | 3.27 | 4.3 |
| Indicated | 0.42/1.31 | 204.7 | 2.52 | 16.5 |
| Meas + Ind | 0.42/1.31 | 245.0 | 2.64 | 20.8 |
| Inferred | 0.42/1.31 | 73.9 | 2.37 | 5.6 |
| EASTERN PORPHYRY | ||||
| Measured | 0.42/1.31 | 2.9 | 6.97 | 0.6 |
| Indicated | 0.42/1.31 | 1,306.4 | 2.35 | 98.8 |
| Meas + Ind | 0.42/1.31 | 1,309.3 | 2.36 | 99.4 |
| Inferred | 0.42/1.31 | 1,198.8 | 2.44 | 94.0 |
| STAMFORD BRIDGE | ||||
| Inferred | 1.20 | 272 | 5.38 | 47.0 |
| TOTAL | ||||
| Measured | 0.42/1.31 | 3,049.6 | 2.37 | 232.6 |
| Indicated | 0.42/1.31 | 7,740.3 | 2.65 | 660.1 |
| Meas + Ind | 0.42/1.31 | 10,789.9 | 2.57 | 892.7 |
| Inferred | 0.42/1.20/1.31 | 9,147.8 | 2.47 | 725.5 |
Notes:
(1) Mineral Resources, which are not Mineral Reserves, may not have demonstrated economic viability. The estimate of Mineral Resources may be materially affected by environmental, permitting, legal, title, taxation, socio-political, marketing, or other relevant issues.
(2) The Inferred Mineral Resource in this estimate has a lower level of confidence than that applied to an Indicated Mineral Resource and must not be converted to a Mineral Reserve. It is reasonably expected that the majority of the Inferred Mineral Resource could be upgraded to an Indicated Mineral Resource with continued exploration.
(3) The Mineral Resources were estimated in accordance with the Canadian Institute of Mining, Metallurgy and Petroleum (CIM), CIM Standards on Mineral Resources and Reserves, Definitions and Guidelines prepared by the CIM Standing Committee on Reserve Definitions and adopted by the CIM Council.
(4) Gold price used is US$1,900/oz Au.
(5) The pit constrained cut-off grade of 0.42 g/t Au was derived from 80% process recovery, US$21.04/tonne process and G&A cost, and a royalty of 7.3%. The constraining pit optimization parameters were US$3.88/t mining cost and 45-degree pit slopes.
(6) The out-of-pit cut-off grade of 1.31 g/t Au was derived from 80% process recovery, US$21.04/tonne process and G&A cost, a US$40/tonne underground mining cost, and a royalty of 7.3%. The out-of-pit Mineral Resource grade blocks were quantified below the constraining pit shell and within the constraining mineralized wireframes. Out–of-Pit Mineral Resources are restricted to areas which exhibit geological continuity and reasonable potential for extraction by cut and fill and long hole mining methods.
(7) The Stamford Bridge cut-off grade of 1.20 g/t Au was derived from 80% process recovery, US$21.04/tonne process and G&A cost, a US$35/tonne underground mining cost, and a royalty of 7.3%. Mineral Resources are restricted to areas which exhibit geological continuity and reasonable potential for extraction by cut and fill and long hole underground mining methods.
Table 9 – TRX 2020 to 2025 Mineral Resource Estimate Transition
| 2020 MRE | 2025 MRE | |||||
| Classification | Tonnes (M) | Au (g/t) | Au oz (k) | Tonnes (M) | Au (g/t) | Au oz (k) |
| Measured & Indicated | 38.6 | 1.77 | 2,195 | 10.8 | 2.57 | 893 |
| Inferred | 19.6 | 1.14 | 718 | 9.1 | 2.47 | 726 |
The generation of an April 15, 2025, Buckreef Gold updated Mineral Resource Estimate (“MRE”) has undertaken material differences in reporting protocols not utilized in the previously published May 15, 2020, MRE. The 2025 MRE utilized the 2014 CIM Standards on Mineral Resources and Reserves and 2019 CIM Best Practices Guidelines and reports Mineral Resources with a reasonable prospect of eventual economic extraction (i.e.: constrained mineral inventory basis), versus the 2020 MRE, which utilized the 2003 CIM Best Practice Guidelines and reports Mineral Resources on an unconstrained mineral inventory basis.
The major sources of differences between the 2020 MRE and 2025 MRE are as follows:
- The 2025 MRE utilized a constrained optimized pit shell and underground workings which resulted in a reduction in volume for material to the 450 m EL level (which is the maximum depth of the underground workings in the PEA) as well as the exclusion of certain footwall and hanging wall low grade material (combined, this resulted in a reduction of ~10 Mt of material grading ~1.50 g/t Au containing ~500 koz);
- The 2025 MRE utilized a cut-off grade of 1.3 g/t Au for underground mining versus a 0.4 g/t Au cut-off grade in 2020 MRE (this resulted in a reduction of ~25 Mt grading ~0.70 g/t Au containing ~500 koz);
- Removal of ~ 4.5 years of production to date (this resulted in a reduction of 1.35 Mt grading 1.95 g/t Au containing 85 koz Au); and
- Removal of Tembo and Bingwa deposits from 2025 MRE due to unquantifiable small scale mining activity by local residents (this resulted in a reduction of 2.1 Mt grading 2.12 g/t Au containing 143 koz).
Mining
Current open pit mining operations have been planned for Years 1 to 4. The first two years will process 1,750 tpd of mineralization, then will increase to 3,000 tpd in Year 3. The Main Pit and the smaller East Pit will be mined out over the four-year period. Low-grade mineralization will be stockpiled for processing at the end of the mine life.
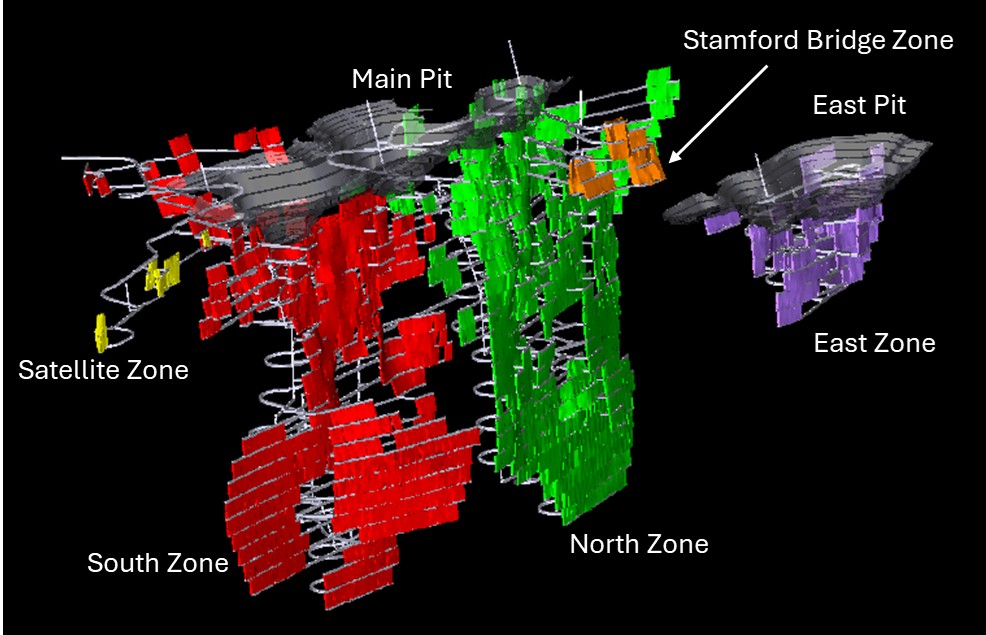
Underground mine development will commence in Year 3. A total of 14.4 Mt of mineralized material at an average grade of 2.22 g/t Au will be extracted over the LOM from five different underground mining areas:
- The Main zone, with 94% of the gold ounces to be mined, subdivided into four areas;
- North, with 55%;
- South, with 34%;
- Stamford Bridge, with 4%; and
- Satellite, with 1%;
- The East zone, with 6% of the ounces to be mined.
The open pits and underground mining areas are shown in Figure 5.
Figure 5 – 3D Projection of the Open Pit and Underground Designs and Mining Areas
The underground mining method will be longhole with longitudinal retreat stopes measuring 3 to 13 m wide, corresponding to 82% of the stope tonnage and transverse longhole mining designed for stopes 13+ m wide, which account for 18% of the stope tonnage. Divisions between transverse and longitudinal mining areas are not strict, with approximately 25% of transverse areas being less than 13m wide and 5% of longitudinal areas being more than 13m wide.
Stope dimensions are planned to be 30 m high, 3 to 15 m wide, and 30 m long. The average transverse stope size is approximately 16 kt, and the average longitudinal stope size is 11 kt. An average of 95 stopes will be mined annually. Stope mining recovery varies from 80 to 95%, and averages 92.4%. Development mining recovery is set at 99%. Stope backfilling is assumed to be 100% cemented paste backfill, although potential exists for co-mingling rockfill with paste, or utilizing unconsolidated rockfill in certain areas.
The underground mine is planned to utilize a contractor. Initial development of two portals in the Main Zone will begin in Year 3, with stoping production commencing in Year 4 and ramping up to the target 1,080 ktpa (3,000 tpd) in Year 5. The underground mining equipment fleet is planned to comprise 50-t class trucks, 17-t class LHDs for development and truck loading, and 10-t class LHDs for production. The contractor will control overall fleet quantities, however, it is estimated that a maximum of 60 pieces of major equipment (trucks, LHDs, drills, jumbos, bolters, scissor decks/services equipment) will be required at any one time. Development utilizes mechanized bolters and 2-boom jumbos, while production drilling utilizes ITH drills. A maximum of four main ventilation raises are planned to ventilate the underground mine utilizing a push-pull system exhausting up the ramp. Primary ventilation raises are expected to be excavated using specialist raisebore contractors.
Metallurgy
Comprehensive metallurgical testing and circuit modelling has highlighted the upside benefits of flotation and fine grinding to improve metallurgical performance. Studies indicate that simply increasing throughput at the current grind size (P₈₀ 75 µm) would yield a suboptimal recovery of 78.6%, which is deemed unacceptable. The introduction of a flotation circuit targeting sulphide concentrates, coupled with regrind and thickening, is expected to improve recovery by approximately 10% to an average of 88%.
Processing
The existing process facility is complete with two trains of three-stage crushing, four closed circuit ball mills, eleven carbon-in-leach (CIL) tanks, and complete elution, electrowinning, and carbon reactivation for the production and sale of the gold doré.
The proposed expansion by TRX Gold is to be done in two phases. Phase 1 capital expenditure will ensure a yearly production rate of 1,750 tpd (636,738 tpa) for Years 1 and 2. Major equipment for this phase includes, but is not limited to:
- Flotation circuit – trash screens, reagent conditioning tank, and five Metso e50 tanks cells (50 cu.m/cell) and blower system;
- Flotation concentrate High Intensity Grinding (“HIG”) mill, to achieve the required product size –Metso HIG700;
- All associated pumping and cycloning within the regrind circuit;
- Concentrate leach feed thickener – 16.5 m diameter;
- Flotation tailings thickener – 16.5 m diameter;
- Two additional CIL tanks to treat the flotation concentrate;
- 4 tonne per day elution circuit, complete; and
- All associated screens, pumps, reagent system, and upgraded water system.
During Years 1 to 2, Phase 2 will be built with a planned processing rate of 3,000 tpd (1,080,000 tpa) to be commissioned in Year 3. Grinding is planned to a target P₈₀ of 150 µm. Major equipment for this phase includes:
- Surge bin, feeders, conveyors for the SAG mill circuit;
- SAG mill – 7.32 m diameter x 3.75 m effective grinding length, 3,500 kW;
- Cyclone cluster with SAG and ball mill(s) circuit; and
- Reverting to a single stage jaw crusher – 750 mm x 1,069 mm for SAG mill feed preparation;
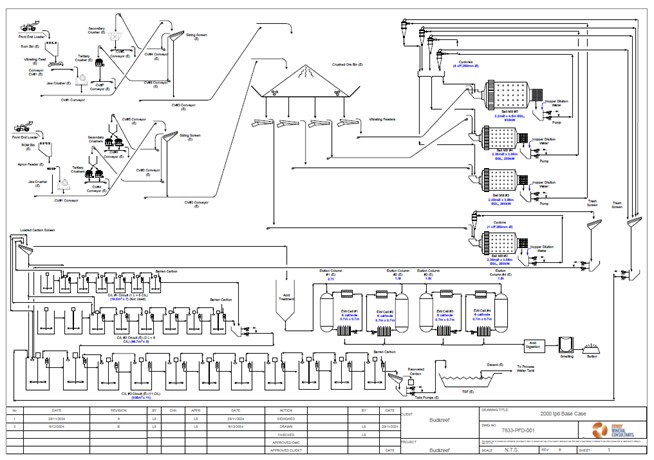
The introduction of a flotation circuit to recover and regrind sulphide concentrates as well as regrinding, thickening, additional CIL capacity and elution circuit expansion is expected to improve overall process recovery to 88%.
Figure 6 – Expansion Flowsheet
Project Infrastructure
Buckreef Gold is approximately 40 km south of the Town of Geita and 110 km south-west of the City of Mwanza. The current mine site contains all infrastructure necessary to operate a 1,750 tpd mining operation. This includes the process plant and tailings facilities, camp for Company personnel and certain contractors, core shack, offices, water treatment plant, fuel distribution facility, mining contractor maintenance shop, warehouses, connection to the national electrical power grid and explosives storage. Security is contracted, and the main mine/infrastructure area is completely fenced.
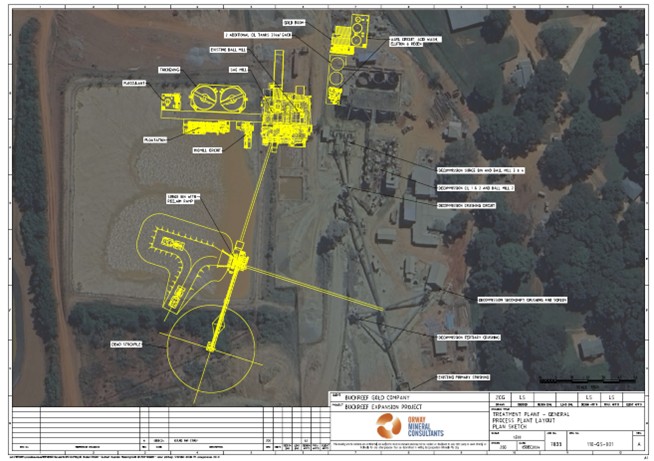
The expanded mineral processing plant will be built within the existing site footprint as shown in Figure 5.
Figure 7 – Process Plant Layout with Expansion Infrastructure
Underground Infrastructure
The main ventilation raises will be bored at 3.4 metres diameter and serve as the primary fresh air intakes with high-efficiency surface fans. In the Main Zone, exhaust air will exit mostly through the main ramp until development in the Stamford Bridge Zone develops the fourth ventilation raise, which serves as a secondary exhaust to reduce airspeed in the ramp and required primary ventilation power draw. The East Zone utilizes a single ventilation raise and a ramp exhaust.
Underground infrastructure includes a service area at the 835 EL connection drift, which will accommodate a welding bay, maintenance bay, tire storage, washing bay, small warehouse, greasing bay and parking. The maintenance bay will allow for simultaneous maintenance of two large equipment units and one smaller unit, ensuring efficient underground operations. The service area is located on the connection drift between the North and South mining areas of the Main Zone, allowing equipment from either area to be maintained at that location. No service area is planned for the East or Satellite Zones, since equipment can transit to surface maintenance areas. Smaller service bays are planned in all Zones, excluding the Satellite Zone, for small-scale maintenance and PM purposes.
Given the large lateral extents of levels in the Main Zone, underground refuge stations are located on every level. In the East Zone, refuges/lunchrooms are located on every second level.
Mine dewatering utilizes cascading sumps to feed water to pump stations located at the bottom of each mining block (approximately 120 m vertical intervals). These pump stations are equipped with settling sumps to segregate solids from clean water, as well as submersible and centrifugal pumps. Pump stations are expected to operate on a 33% duty cycle. Pump stations, sumps, electrical bays, refuges, shops and powder magazines are not explicitly included in the design, however, have been accounted for in the development schedule, with associated costs in the project financial model.
Tailings and Waste Rock Management
In Q2 2025, the Company started TSF 2.2 Phase II construction. Lift 1 is essentially complete with some minor clean up and earthwork finish grading required. Lift 2 is now in progress, which will provide tailings until Q1 2026 and will achieve a final approved elevation of 1,240 m. This work includes, embankment, compaction, slope finishing, HDPE liner installation, erosion control, and access road construction.
The Company is now working on the engineering design and regulatory work required prior to starting construction of the future TSF 3.0, the Company’s next long-term tailings storage solution that will be adequate for the remaining LOM.
A significant portion of tailings produced during the underground mining life will be placed in stopes as cemented paste backfill.
Closure Plan
An updated closure and rehabilitation plan for the land affected by Buckreef Gold will be prepared and submitted for authorization. Progressive reclamation estimated at US$3.4 million is planned at the open pit areas since they will be completed after the first four years of the LOM plan. The preliminary concept for final site closure cost is estimated at US$10 million, net of credit for equipment salvage value.
Qualified Persons – PEA Authors
The PEA was prepared by consultants who are independent of TRX Gold, each of whom are Qualified Persons (“QP”) as defined by National Instrument 43-101 Standards of Disclosure for Mineral Projects (“NI 43-101”). Each of the QPs have reviewed and confirmed that this news release fairly and accurately reflects, in the form and context in which it appears, the information contained in the respective sections of the PEA for which they are responsible.
The following acted as Qualified Persons under NI 43-101 as authors of the PEA:
P&E Mining Consultants Inc.
Eugene Puritch, P.Eng., FEC, CET – Mineral Resources
Andrew Bradfield, P.Eng. – Study leader and open pit mine design, scheduling and costs
D. Gregory Robinson, P.Eng. – Underground mine design, scheduling and costs
D. Grant Feasby, P.Eng. – Environmental
Fred H. Brown, P.Geo. – Mineral Resources
Yungang Wu, P.Geo. – Mineral Resources
William Stone, Ph.D., P.Geo. – Tenure, geology, drilling
Jarita Barry, P.Geo. – Data verification, QA/QC
D.E.N.M. Engineering Ltd.
David Salari, P.Eng. – Process plant expansion and process plant costing
Mr. William van Breugel, P.Eng, BASc (Hons), Technical Advisor to TRX Gold Corporation, is the Company’s Qualified Person under NI 43-101 and has reviewed and assumes responsibility for the scientific and technical content in this press release.
PEA / Q2 Results Conference Call and Webcast Details (Same as Q2 Call)
When: Wednesday, April 23 at 9:00 AM EST
Webcast link: https://www.c-meeting.com/web3/joinTo/MP9MKT3Z8WQC2Z/35mUcC-RBRd602oA-Xk8rw
Conference call numbers:
Canada/USA TF: 1-833-752-3900
International Toll: +1-647-849-3080
A replay will be made available for 30 days following the call on the Company’s website.
About TRX Gold Corporation
TRX Gold is a high margin and growing gold company advancing the Buckreef Gold Project in Tanzania. Buckreef Gold includes an established open pit operation and 2,000 tonnes per day process plant with upside potential demonstrated in the April 2025 Preliminary Economic Assessment (the “PEA”). The PEA outlines average gold production of 62,000 oz per annum over 17.6 years, and US$701 million pre-tax NPV5% at average life of mine gold price of US$2,296/oz. The project hosts a Measured and Indicated Mineral Resource of 10.8 million tonnes (“MT”) at 2.57 grams per tonne (“g/t”) gold containing 893,000 ounces (“oz”) of gold and an Inferred Mineral Resource of 9.1 MT at 2.47 g/t gold for 726,000 oz of gold. The leadership team is focused on creating both near-term and long-term shareholder value by increasing gold production to generate positive cash flow to fund the expansion as outlined in the PEA and grow Mineral Resources through exploration. TRX Gold’s actions are led by the highest environmental, social and corporate governance (“ESG”) standards, evidenced by the relationships and programs that the Company has developed during its nearly two decades of presence in the Geita Region, Tanzania.
For investor or shareholder inquiries, please contact:
Investors:
Investor Relations
TRX Gold Corporation
+1 844 GOLD TRX (844-465-3879)
IR@TRXgold.com
www.TRXgold.com
Non-IFRS Performance Measures
The Company has included certain non-IFRS financial measures in this news release, such as growth capital cost, sustaining capital cost, total capital cost, Total or LOM cash cost, and AISC, which are not measures recognized under IFRS and do not have a standardized meaning prescribed by IFRS. As a result, these measures may not be comparable to similar measures reported by other corporations. Each of these measures used are intended to provide additional information to the user and should not be considered in isolation or as a substitute for measures prepared in accordance with IFRS. Non-IFRS financial measures used in this news release and common to the gold mining industry are defined below.
Total Cash Costs and Total Cash Costs per Ounce
Total cash costs are reflective of the cost of production. Total cash costs reported in the PEA include mining costs, processing and water treatment costs, general and administrative costs of the mine, off-site costs, refining costs, transportation costs and royalties. Total cash costs per ounce is calculated as total cash costs divided by payable gold ounces.
AISC and AISC per Ounce
AISC is reflective of all of the expenditures that are required to produce an ounce of gold from operations. AISC reported in the PEA includes total cash costs, sustaining capital, closure costs and salvage, but excludes corporate general and administrative costs. AISC per ounce is calculated as AISC divided by payable gold ounces.
Forward-Looking and Cautionary Statements
This press release contains certain forward-looking statements as defined in the applicable securities laws. All statements, other than statements of historical facts, are forward-looking statements. Forward-looking statements are frequently, but not always, identified by words such as “expects”, “anticipates”, “believes”, “hopes”, “intends”, “estimated”, “potential”, “possible” and similar expressions, or statements that events, conditions or results “will”, “may”, “could” or “should” occur or be achieved. Forward-looking statements relate to future events or future performance and reflect TRX Gold management’s expectations or beliefs regarding future events and include, but are not limited to, statements with respect to results set forth in the PEA, continued operating cash flow, expansion of its process plant under the terms, exploration and conditions set forth in the PEA, expanding its open pit mining and initiating underground mining, current and anticipated price of gold, mine development plans, estimation of Mineral Resources, ability to develop value creating activities, recoveries, subsequent project testing, success, scope and viability of mining operations, the timing and amount of estimated future production, and capital expenditure.
Although TRX Gold believes the expectations expressed in such forward-looking statements are based on reasonable assumptions, such statements are not guarantees of future performance. The actual achievements of TRX Gold or other future events or conditions may differ materially from those reflected in the forward-looking statements due to a variety of risks, uncertainties and other factors. These risks, uncertainties and factors include general business, legal, economic, competitive, political, regulatory and social uncertainties; actual results of exploration activities and economic evaluations; fluctuations in currency exchange rates; changes in costs; future prices of gold and other minerals; mining method, production profile and mine plan; delays in exploration, development and construction activities; changes in government legislation and regulation; the ability to obtain financing on acceptable terms and in a timely manner or at all; contests over title to properties; employee relations and shortages of skilled personnel and contractors; the speculative nature of, and the risks involved in, the exploration, development and mining business. These risks are set forth in reports that TRX Gold files with the SEC and the various Canadian securities authorities. You can review and obtain copies of these filings from the SEC’s website at http://www.sec.gov/edgar.shtml and the Company’s profile on the System for Electronic Document Analysis and Retrieval (“SEDAR+”) at www.sedarplus.ca.
Technical information contained in this press release is as of the date of the press release and TRX Gold assumes no duty to update such information.
Photos accompanying this announcement are available at
https://www.globenewswire.com/NewsRoom/AttachmentNg/6a94db9a-a3be-475a-8a5b-97064a291150
https://www.globenewswire.com/NewsRoom/AttachmentNg/d80a57be-b0f3-4844-b61a-99c4d6c4dfb4
https://www.globenewswire.com/NewsRoom/AttachmentNg/890e8f5c-adda-40e7-bd11-696ed42f16a4
https://www.globenewswire.com/NewsRoom/AttachmentNg/e49424cb-7bda-4325-b95b-db03e0cc3dc3
https://www.globenewswire.com/NewsRoom/AttachmentNg/97058290-d06c-4836-83aa-86b83ccdda34
https://www.globenewswire.com/NewsRoom/AttachmentNg/6cd8d105-4cde-491f-b10f-1db5aa06207e
https://www.globenewswire.com/NewsRoom/AttachmentNg/7d3e17fe-d856-442c-a165-a3131d65e39e
https://www.globenewswire.com/NewsRoom/AttachmentNg/c26d3f6c-07d0-4c74-b168-97f89107a59c
![]()
