Syntec Optics Holdings, Inc. (Nasdaq: OPTX) Reports Fourth Quarter and Full Year 2025 Results
Margin Expansion and Cost Reduction lead to Growth in Adj EBITDA
ROCHESTER, NEW YORK, March 31, 2026 (GLOBE NEWSWIRE) — Syntec Optics Holdings, Inc. (Nasdaq: OPTX) (“Syntec” or the “Company”), a leading provider of technology across defense, biomedical, communications, and consumer end-markets, today reported that the previously announced Company’s focus on operations efficiency had a positive impact on financial results for the fourth quarter and full year ended December 31, 2025.
Q4 2025 Highlights
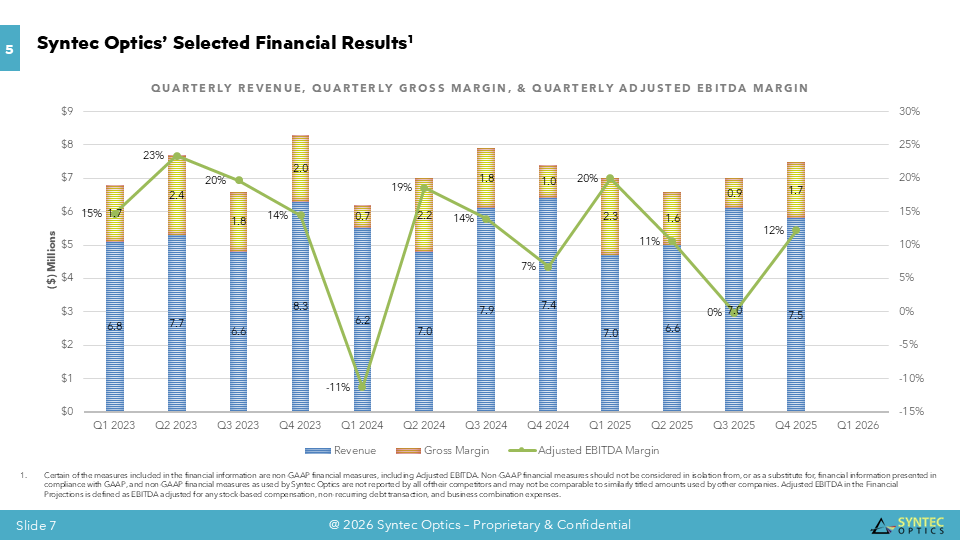
- Gross margin saw significant expansion, nearly doubling compared to the same-year previous quarter and prior-year quarter (Gross Margin for Q4 2024 was 13%, Q3 2025 was 12%, and Q4 2025 was 24%).
- Gross profit also saw significant improvement, increased 100% sequentially and increased 80% compared to the prior year (Gross Profit for Q4 2024 was $1 million, Q3 2025 was $0.9 million, and Q4 2025 was $1.8 million).
- SG&A expense also saw significant improvement, decreased 30% sequentially and decreased by 40% compared to the prior year (SG&A expense for Q4 2024 was $2.4 million, Q3 2025 was $2.1 million, and Q4 2025 was at $1.5 million).
- As a result of the above improvements, Adj EBITDA increased by nearly $1 million (Adj EBITDA for Q4 2024 was $0.5 million, Q3 2025 was negative $0.01 million, and Q4 2025 was $0.9 million).
- These improvements in the fourth quarter were achieved on Net Sales of $7.5 million, an increase of 8% from Q3 2025, and similar to Q4 2024 Net Sales.
Results for the year-end followed a similar path, reflecting enhanced yields, cost discipline, and operational execution.
Full Year 2025 Highlights
- Gross margin increased by 3.3% as compared to the prior year (Gross Margin for full year 2024 was 20%, full year 2025 was 23.3%).
- Gross profit increased by 13% as compared to the prior year (Gross Profit for full year 2024 was $5.7 million, and full year 2025 was $6.5 million).
- SG&A expense decreased by $1.2 million as compared to the prior year (SG&A for full year 2024 was $8.2 million, and full year 2025 was $7.0 million).
- Adj EDITDA also saw significant improvement, increased by 36% versus the prior year (Adj EBITDA for full year 2024 was $2.2 million, and full year 2025 came in at $3.0 million).
- These improvements for the full year were achieved even with Net Sales of $28.1 million, down $0.4 million from full year 2024.
- As a result of the improvements above, EPS of $(0.05) in 2025 improved from $(0.07) in 2024.
- Cash provided by operations increased to $0.7 million and was used for facility improvements and equipment. Cash, including line of credit availability, was at $1.1 million.
Operational Execution
- Yield and throughput improvements across key programs, including LEO satellite optics, night vision optics, and integrated optical assemblies, continued.
- Night shift staffing expanded to support scalable production capacity.
- Multiple programs advanced from design → pilot → initial production.
- Ongoing cost reduction initiatives contributed to margin expansion.
2026 Outlook
Syntec expects growth in 2026, supported by:
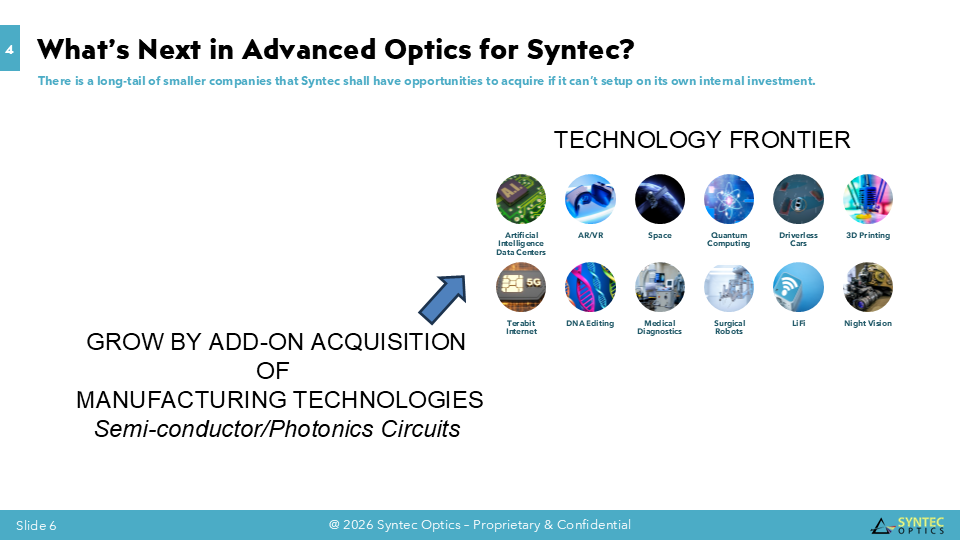
- Ramp of next-generation communications, new space and AI/data center optics products.
- Expansion in defense programs driven by onshoring tailwinds.
- Steady growth across biomedical and consumer end markets.
- Conversion of design-stage programs into production revenue.
Near-Term Guidance
Compared to Q4 2025 Net Sales of $7.5 million, Q1 2026 Net Sales are expected to be below $7.5 million, and Q2 2026 Net Sales are expected to be above $7.5 million. 2026 started with space optics production increasing to a record level, the beginning of the production stage for the artificial intelligence data center product line, and the previously announced addition of a new product line in defense tech. Additional product lines for defense tech are anticipated to add to Net Sales in Q2 and beyond.
About Syntec Optics
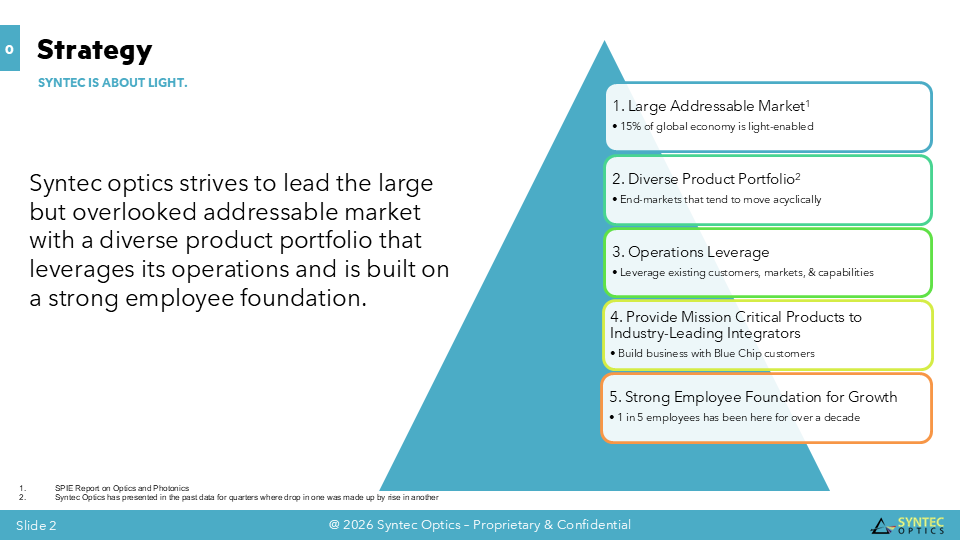
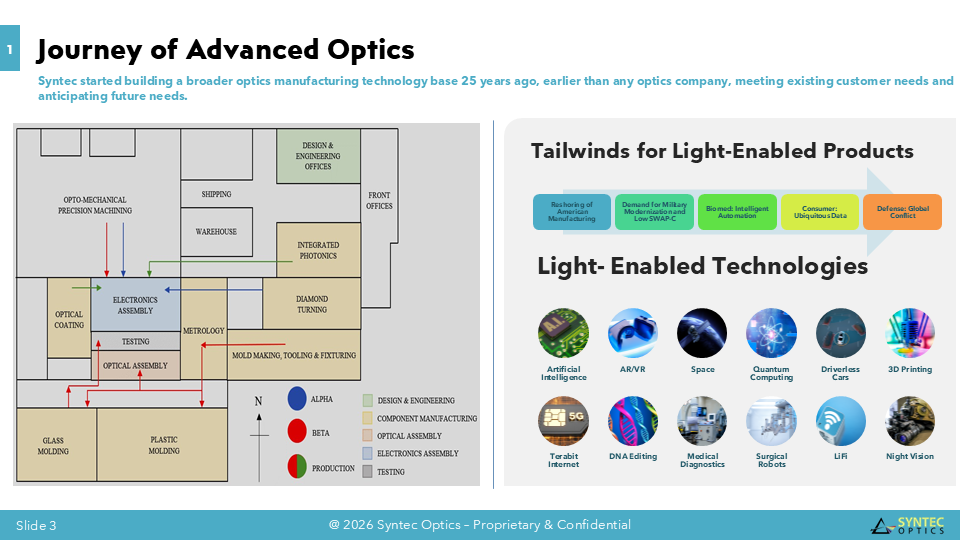
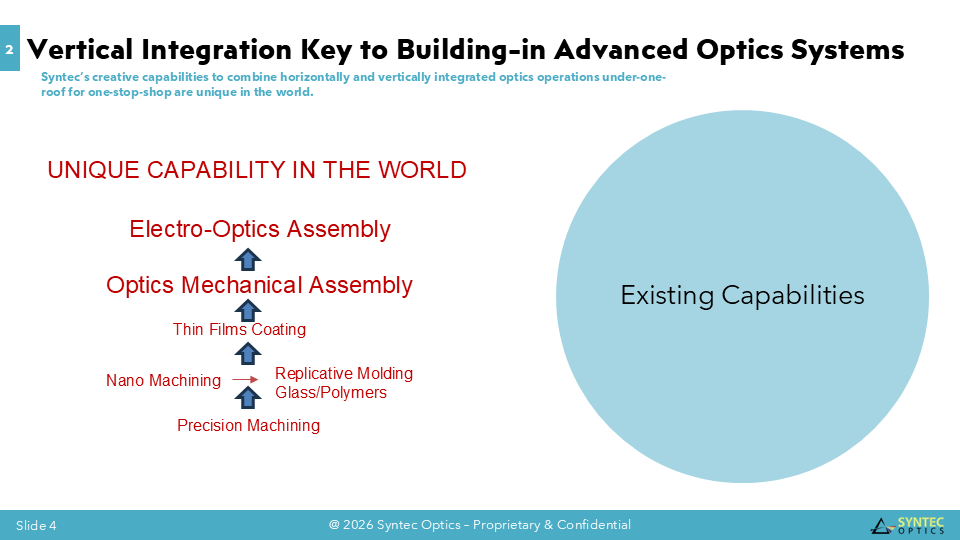
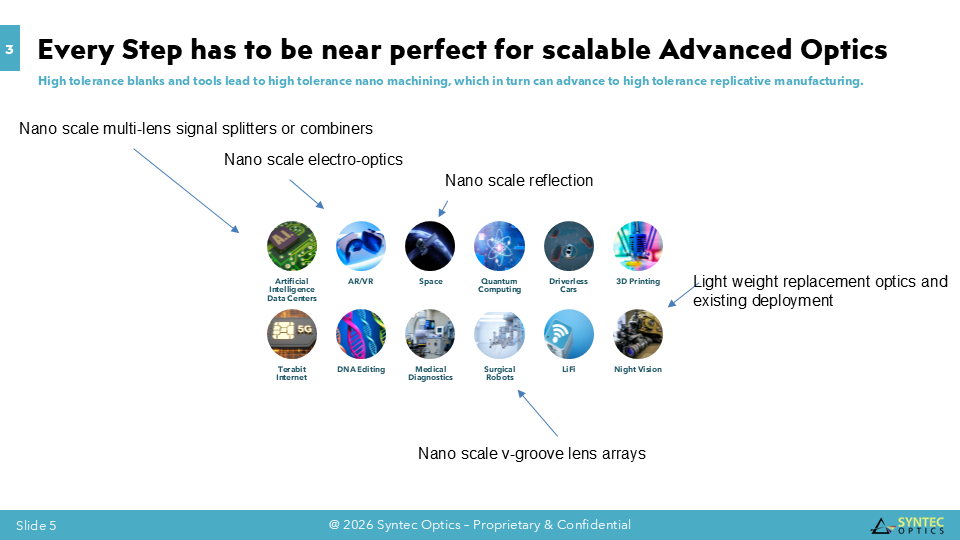
Syntec Optics Holdings, Inc. (Nasdaq: OPTX), headquartered in Rochester, NY, is one of the largest custom and diverse end-market optics and photonics manufacturers in the United States. Operating for over two decades, Syntec Optics runs a state-of-the-art facility with extensive core capabilities of various optics manufacturing processes, both horizontally and vertically integrated, to provide a competitive advantage for mission-critical OEMs. As more products become light-enabled, Syntec Optics continues to add new product lines, including recent Low Earth Orbit (LEO) satellite optics for communications, lightweight night-vision goggle optics for defense, biomedical optics for diagnostics and surgery, and data center optics for Artificial Intelligence. According to SPIE, across the entire field of optics and photonics, the monetary value of all light-enabled products and related services amounts to over 15% of worldwide economic output (nearly $16 trillion of the total $106 trillion value of all finished goods and services produced worldwide in 2023).To learn more, visit www.syntecoptics.com.
Forward-Looking Statements
This press release contains certain “forward-looking statements” within the meaning of the United States Private Securities Litigation Reform Act of 1995, Section 27A of the Securities Act of 1933, as amended (the “Securities Act”) and Section 21E of the Securities Exchange Act of 1934, as amended, including certain financial forecasts and projections. All statements other than statements of historical fact contained in this press release, including statements as to the transactions contemplated by the business combination and related agreements, future results of operations and financial position, revenue and other metrics, planned products and services, business strategy and plans, objectives of management for future operations of Syntec Optics, market size, and growth opportunities, competitive position and technological and market trends, are forward-looking statements. Some of these forward-looking statements can be identified by the use of forward-looking words, including “may,” “should,” “expect,” “intend,” “will,” “estimate,” “anticipate,” “believe,” “predict,” “plan,” “targets,” “projects,” “could,” “would,” “continue,” “forecast” or the negatives of these terms or variations of them or similar expressions. All forward-looking statements are subject to risks, uncertainties, and other factors (some of which are beyond the control of Syntec Optics), which could cause actual results to differ materially from those expressed or implied by such forward-looking statements. All forward-looking statements are based upon estimates, forecasts and assumptions that, while considered reasonable by Syntec Optics and its management, as the case may be, are inherently uncertain and many factors may cause the actual results to differ materially from current expectations which include, but are not limited to: 1) risk outlined in any prior SEC filings; 2) ability of Syntec Optics to successfully increase market penetration into its target markets; 3) the addressable markets that Syntec Optics intends to target do not grow as expected; 4) the loss of any key executives; 5) the loss of any relationships with key suppliers including suppliers abroad; 6) the loss of any relationships with key customers; 7) the inability to protect Syntec Optics’ patents and other intellectual property; 8) the failure to successfully execute manufacturing of announced products in a timely manner or at all, or to scale to mass production; 9) costs related to any further business combination; 10) changes in applicable laws or regulations; 11) the possibility that Syntec Optics may be adversely affected by other economic, business and/or competitive factors; 12) Syntec Optics’ estimates of its growth and projected financial results for the future and meeting or satisfying the underlying assumptions with respect thereto; 13) the impact of any pandemic, including any mutations or variants thereof and the Russian/Ukrainian or Israeli conflict, and any resulting effect on business and financial conditions; 14) inability to complete any investments or borrowings in connection with any organic or inorganic growth; 15) the potential for events or circumstances that result in Syntec Optics’ failure to timely achieve the anticipated benefits of Syntec Optics’ customer arrangements; and 16) other risks and uncertainties set forth in the sections entitled “Risk Factors” and “Cautionary Note Regarding Forward-Looking Statements” in prior SEC filings including registration statement on Form S-4 filed with the SEC. These filings identify and address other important risks and uncertainties that could cause actual events and results to differ materially from those contained in the forward-looking statements. Nothing in this press release should be regarded as a representation by any person that the forward-looking statements set forth herein will be achieved or that any of the contemplated results of such forward-looking statements will be achieved. You should not place undue reliance on forward-looking statements, which speak only as of the date they are made. Syntec Optics does not give any assurance that Syntec Optics will achieve its expected results. Syntec Optics does not undertake any duty to update these forward-looking statements except as otherwise required by law.
For further information, please contact:
Investor Relations
InvestorRelations@syntecoptics.com
SOURCE: Syntec Optics Holdings, Inc. (Nasdaq: OPTX)

SYNTEC OPTICS HOLDINGS, INC.
CONSOLIDATED BALANCE SHEETS
DECEMBER 31, 2025 AND 2024
| 2025 | 2024 | |||||||
| ASSETS | ||||||||
| Current Assets | ||||||||
| Cash | $ | 358,867 | $ | 598,787 | ||||
| Accounts Receivable, Net | 6,241,768 | 5,739,205 | ||||||
| Inventory | 7,884,943 | 6,953,278 | ||||||
| Prepaid Expenses and Other Assets | 655,827 | 596,589 | ||||||
| Income Tax Receivable | – | 9,794 | ||||||
| Total Current Assets | 15,141,405 | 13,897,653 | ||||||
| Property and Equipment, Net | 9,172,703 | 11,668,859 | ||||||
| Deferred Tax Asset | – | 439,942 | ||||||
| Total Assets | $ | 24,314,108 | $ | 26,006,454 | ||||
| LIABILITIES AND STOCKHOLDERS’ EQUITY | ||||||||
| Current Liabilities | ||||||||
| Accounts Payable | $ | 2,691,748 | $ | 2,706,392 | ||||
| Accrued Expenses | 683,397 | 814,600 | ||||||
| Federal Income Tax Payable | 169,582 | – | ||||||
| Deferred Revenue | 66,420 | 36,512 | ||||||
| Line of Credit | 6,763,863 | 6,263,863 | ||||||
| Current Maturities of Debt Obligations | 93,358 | 467,742 | ||||||
| Current Maturities of Debt Obligations – Related Party | 406,495 | – | ||||||
| Current Maturities of Debt Obligations | 406,495 | – | ||||||
| Current Maturities of Finance Lease Obligations | 354,499 | 284,002 | ||||||
| Total Current Liabilities | 11,229,362 | 10,573,111 | ||||||
| Long-Term Liabilities | ||||||||
| Long-Term Debt Obligations | 860,548 | 2,614,812 | ||||||
| Long-Term Debt Obligations – Related Party | 1,268,732 | – | ||||||
| Long-Term Debt Obligations | 1,268,732 | – | ||||||
| Long-Term Finance Lease Obligations | 1,414,611 | 1,784,449 | ||||||
| Total Long-Term Liabilities | 3,543,891 | 4,399,261 | ||||||
| Total Liabilities | 14,773,253 | 14,972,372 | ||||||
| Commitments and Contingencies | – | – | ||||||
| Stockholders’ Equity | ||||||||
| CL A Common Stock, Par value $.0001 per share; 121,000,000 authorized; 36,920,226 issued and outstanding as of December 31, 2025; 36,688,266 issued and outstanding as of December 31, 2024 | 3,692 | 3,669 | ||||||
| Additional Paid-In Capital | 2,677,181 | 2,377,204 | ||||||
| Retained Earnings | 6,859,982 | 8,653,209 | ||||||
| Total Stockholders’ Equity | 9,540,855 | 11,034,082 | ||||||
| Total Liabilities and Stockholders’ Equity | $ | 24,314,108 | $ | 26,006,454 | ||||
SYNTEC OPTICS HOLDINGS, INC.
CONSOLIDATED STATEMENTS OF OPERATIONS
FOR THE YEARS ENDED DECEMBER 31, 2025 AND 2024
| 2025 | 2024 | |||||||
| Net Sales | $ | 28,083,985 | $ | 28,449,941 | ||||
| Cost of Goods Sold | 21,554,285 | 22,747,615 | ||||||
| Gross Profit | 6,529,700 | 5,702,326 | ||||||
| General and Administrative Expenses | 7,047,300 | 8,278,720 | ||||||
| Loss from Operations | (517,600 | ) | (2,576,394 | ) | ||||
| Other (Expense) Income | ||||||||
| Other (Expense) Income | (39,875 | ) | 346,835 | |||||
| Interest Expense, Including Amortization of Debt Issuance Costs | (795,810 | ) | (764,934 | ) | ||||
| Total Other Expense | (835,685 | ) | (418,099 | ) | ||||
| Loss Before Provision for (Benefit) Income Taxes | (1,353,285 | ) | (2,994,493 | ) | ||||
| Provision (Benefit) for Income Taxes | 439,942 | (514,832 | ) | |||||
| Net Loss | $ | (1,793,227 | ) | $ | (2,479,661 | ) | ||
| Net Loss per Common Share | ||||||||
| Basic and diluted | $ | (0.05 | ) | $ | (0.07 | ) | ||
| Weighted Average Number of Common Shares Outstanding | ||||||||
| Basic and diluted | 36,920,226 | 36,688,266 | ||||||
SYNTEC OPTICS HOLDINGS, INC.
CONSOLIDATED STATEMENTS OF CASH FLOWS
FOR THE YEARS ENDED DECEMBER 31, 2025 AND 2024
| 2025 | 2024 | |||||||
| Cash Flows From Operating Activities | ||||||||
| Net Loss | $ | (1,793,227 | ) | $ | (2,479,661 | ) | ||
| Adjustments to Reconcile Loss to Net Cash (Used In) | ||||||||
| Provided By Operating Activities: | ||||||||
| Adjustments to Reconcile Loss to Net Cash (Used In) Provided By Operating Activities: | ||||||||
| Depreciation and Amortization | 2,613,229 | 2,765,713 | ||||||
| Amortization of Debt Issuance Costs | 15,501 | 15,057 | ||||||
| Stock-Based Compensation | 300,000 | 450,000 | ||||||
| Gain on Disposal of Property and Equipment | – | (309,000 | ) | |||||
| Change in Allowance for Expected Credit Losses | 15,869 | (121,767 | ) | |||||
| Change in Reserve for Obsolescence | 80,667 | 186,285 | ||||||
| Deferred Income Taxes | 439,942 | (514,832 | ) | |||||
| (Increase) Decrease in: | ||||||||
| Accounts Receivable | (518,432 | ) | 1,182,626 | |||||
| Inventory | (1,012,332 | ) | (1,305,454 | ) | ||||
| Prepaid Expenses and Other Assets | (59,238 | ) | (237,146 | ) | ||||
| Increase (Decrease) in: | ||||||||
| Accounts Payables and Accrued Expenses | 381,372 | (231,163 | ) | |||||
| Federal Income Tax Payable | 179,376 | (380,000 | ) | |||||
| Deferred Revenue | 29,908 | 36,512 | ||||||
| Net Cash Provided By (Used In) Operating Activities | 672,635 | (942,830 | ) | |||||
| Cash Flows From Investing Activities | ||||||||
| Purchases of Property and Equipment | (644,292 | ) | (1,239,866 | ) | ||||
| Proceeds from Disposal of Property and Equipment | – | 309,000 | ||||||
| Net Cash Used in Investing Activities | (644,292 | ) | (930,866 | ) | ||||
| Cash Flows From Financing Activities | ||||||||
| Borrowing on Line of Credit, Net | 500,000 | (273,729 | ) | |||||
| Borrowing on Debt Obligations | – | 1,100,388 | ||||||
| Borrowing on Debt Obligations – Related Parties | 1,268,732 | – | ||||||
| Repayments on Debt Obligations | (1,737,654 | ) | (420,802 | ) | ||||
| Repayments on Finance Lease Obligations | (299,341 | ) | (91,619 | ) | ||||
| Net Cash (Used In) Provided By Financing Activities | (268,263 | ) | 314,238 | |||||
| Net Decrease in Cash | (239,920 | ) | (1,559,458 | ) | ||||
| Cash – Beginning | 598,787 | 2,158,245 | ||||||
| Cash – Ending | $ | 358,867 | $ | 598,787 | ||||
| Supplemental Cash Flow Disclosures: | ||||||||
| Cash Paid for Interest | $ | 756,519 | $ | 738,010 | ||||
| Cash Paid for Taxes | $ | – | $ | 568,143 | ||||
| Supplemental Disclosures of Non-Cash Investing Activities: | ||||||||
| (Decrease) Increase in Assets Acquired and Included in AP | $ | 527,219 | $ | 198,584 | ||||
| Issuance of finance lease for acquisition of equipment | $ | 2,160,070 | ||||||
| De-recognition of PPE and Intangible Asset transaction | $ | – | $ | 560,000 | ||||
NON-GAAP RECONCILIATION OF EBITDA
FOR THE YEARS ENDED DECEMBER 31, 2025 AND 2024
| 2025 | 2024 | |||||||
| Net Loss | $ | (1,793,227 | ) | $ | (2,479,661 | ) | ||
| Stock-Based Compensation Expense BOD (1) | 300,000 | 450,000 | ||||||
| Depreciation & Amortization | 2,613,229 | 2,765,713 | ||||||
| Amortization of Debt Issuance Costs | 15,501 | 9,222 | ||||||
| Interest Expenses | 756,519 | 738,010 | ||||||
| Taxes | 439,942 | (514,832 | ) | |||||
| Non-Recurring Items | ||||||||
| Executive Transition (2) | 579,161 | 379,389 | ||||||
| Nonrecurring Banking Fees (3) | 63,416 | |||||||
| Nonrecurring professional Fees (4) | 174,500 | |||||||
| Technology Start-up Costs (5) | 344,496 | |||||||
| Optical Molding Evaluation Expenses (6) | 201,908 | |||||||
| Glass Molding Evaluation Expenses (6) | 130,196 | |||||||
| One-time Contract exit costs | 21,063 | |||||||
| Non-recurring property damage | 21,261 | |||||||
| Adjusted EBITDA | $ | 3,016,865 | $ | 2,198,941 | ||||
![]()
