NRSInsights’ February 2024 Retail Same-Store Sales Report
National Retail Solutions

February same-store sales per calendar day increased 3.5% year-over-year and 7.4% sequentially
Retailers in certain Western states recorded the largest year-over-year gains as winter storms triggered stockpiling
Average prices increased 1.2% year-over-year
NEWARK, N.J., March 08, 2024 (GLOBE NEWSWIRE) — NRSInsights, a provider of sales data and analytics drawn from retail transactions processed through the National Retail Solutions (NRS) point-of-sale (POS) platform, today announced comparative same-store sales results for February 2024.
As of February 29, 2024, the NRS retail network comprised approximately 29,100 active terminals scanning purchases at independent retailers including bodegas, convenience stores, liquor stores, grocers, tobacco, and sundries sellers nationwide, predominantly serving urban consumers.
February Retail Same-Store Sales Highlights
(Same-store sales, unit sales, transactions, and average price data refer to February 2024 unless otherwise noted. All comparisons are provided on a “per calendar day” basis to remove from consideration variability in the number of days per month including the additional day for leap year in February 2024 compared to February 2023.)
- Same-store sales increased 3.5% from a year earlier (February 2023). In January 2024, average sales had increased 1.4% compared to January 2023.
- NRS retail stores in Arizona, Montana and Wyoming generated the highest rates of year-over-year increases.
- Same-store sales increased 7.4% compared to January 2024, consistent with the expected seasonal rebound from the post-holiday dip in January. Same-store sales in January 2024 had decreased 10.0% compared to December 2023.
- For the three months ended February 29, 2024, same-store sales increased 2.8% compared to the three months ended February 28, 2023.
- The number of items sold increased 4.4% compared to February 2023, the same rate of increase as for January 2024 compared to January 2023.
- The average number of transactions per store increased 2.0% compared to February 2023. For January 2024, the average number of transactions had decreased 0.6% compared to January 2023.
- A dollar-weighted average of prices for the top 500 items purchased increased 1.2% year-over-year, an increase from the 0.3% year-over-year increase recorded in January 2024, but still well below the 2023 peak level of 5.3% in September.
Commentary from Suzy Silliman (SVP, Data Strategy and Sales at NRS)
“Same-store sales in February – adjusting for the leap year – rebounded from the annual post-holiday retrenchment in January, to increase 7.4% sequentially and 3.5% compared to February 2023. Nearly all categories experienced sequential growth with the notable exceptions of prepared foods and baking staples which declined from January sales levels.
“February’s sales are always interesting because of consumer spending patterns leading up to Valentine’s Day. This February, Candy sales jumped in February after several months of sequential decreases – which was no surprise – but also increased strongly versus February a year ago. On the other hand, sales in the Sparkling Wine/Champagne category, which traditionally spike during this holiday, suffered a decrease of ~7% compared to February 2023.
“Regionally, our retailers in Arizona, Montana and Wyoming saw the most significant year-over-year same-store sales growth. Looking at the data, it is likely that winter weather events in each state drove pre-storm stockpiling.”
Retail Trade Comparative Data
The table below provides historical comparative data with the U.S. Commerce Department’s Advance Monthly Retail Trade same-store sales data excluding food service:
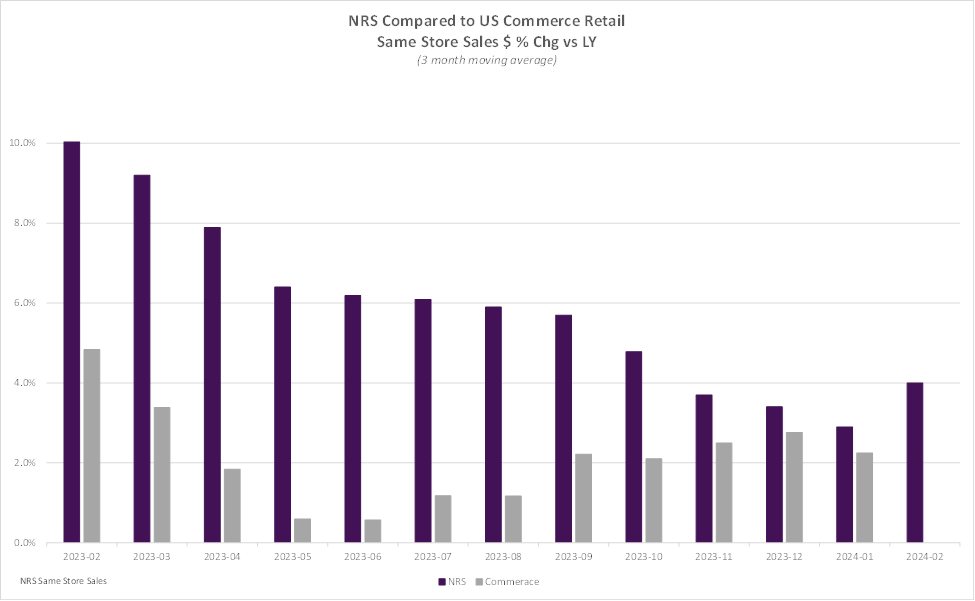
Over the past twelve months, the NRS network’s three-month moving average same-store sales have outpaced the US Commerce Department’s Advance Monthly Retail Trade data excluding food services by 4.3% percentage points, on average.
The NRSInsights data have not been adjusted to reflect inflation, demographic distributions, seasonal buying patterns, item substitution, or other factors that may facilitate comparisons to other periods, to other same-store retail sales data, or to the U.S. Commerce Department’s retail data.
NRSInsights Reports
The NRSInsights monthly Same-Store Retail Sales Reports are intended to provide timely topline data reflective of sales at NRS’ network of independent, predominantly urban, retail stores.
Same-store data comparisons of February 2024 with February 2023 are derived from approximately 151 million transactions processed through the 16,886 stores on the NRS network that scanned transactions in both months. Same-store data comparisons of January 2024 with December 2023 are derived from approximately 202 million transactions processed through 24,265 stores.
Same-store data comparisons for the three months ended February 29, 2024 with the year-ago three months are derived from approximately 449 million scanned transactions processed through the stores that were in the NRS network in both quarters.
NRS POS Network
The NRS network comprises approximately 29,100 active POS terminals operating in approximately 25,300 independent retail stores. Its platform predominantly serves small-format, independent, retail stores including convenience stores, bodegas, liquor stores, grocers, tobacco and sundries sellers. The network includes retailers in all 50 states and in 197 of the 210 designated market areas (DMAs) in the United States. Over the past twelve months, NRS’ POS terminals have processed $17.8 billion in sales through approximately 1.3 billion transactions.
About National Retail Solutions (NRS):
National Retail Solutions operates the largest point-of-sale (POS) terminal-based platform and digital payment processing service for independent retailers nationwide. Retailers utilize NRS offerings to process transactions and effectively manage their businesses. Consumer packaged goods (CPG) suppliers, brokers, analytics firms, and advertisers access the terminal’s digital display network to reach these retailers’ predominantly urban, multi-cultural shopper base, and to harness transaction data-based learnings to identify growth opportunities and measure execution and returns on marketing investment. NRS is a subsidiary of IDT Corporation (NYSE: IDT).
All statements above that are not purely about historical facts, including, but not limited to, those in which we use the words “believe,” “anticipate,” “expect,” “plan,” “intend,” “estimate,” “target” and similar expressions, are forward-looking statements within the meaning of the Private Securities Litigation Reform Act of 1995. While these forward-looking statements represent our current judgment of what may happen in the future, actual results may differ materially from the results expressed or implied by these statements due to numerous important factors. Our filings with the SEC provide detailed information on such statements and risks, and should be consulted along with this release. To the extent permitted under applicable law, IDT assumes no obligation to update any forward-looking statements.
NRSInsights Contact:
Suzy Silliman
SVP, Data Strategy and Sales at NRS
National Retail Solutions
suzy.silliman@nrsplus.com
IDT Corporation Contact:
Bill Ulrey
william.ulrey@idt.net
# # #
Attachment
![]()
