K92 Mining Announces Strong Q2 2026 Financial Results – Record Net Cash Position and Significant Stage 3 Expansion Ramp-Up Progress, with Multiple Operational Records
VANCOUVER, British Columbia, Aug. 10, 2026 (GLOBE NEWSWIRE) — K92 Mining Inc. (“K92” or the “Company”) (TSX: KNT; OTCQX: KNTNF) is pleased to announce financial results for the three months ended June 30, 2026.
Production
- Strong quarterly production of 46,093 ounces gold equivalent (“AuEq”)(1) or 42,931 oz gold, 1,780,506 lbs copper and 50,109 oz silver (Figure 1), and quarterly sales of 46,682 oz gold, 1,811,181 lbs copper and 49,004 oz silver.
- Net of by-product credit basis cash costs of $859/oz gold and all-in sustaining costs (“AISC”) of $1,376/oz gold(2), co-product basis cash costs of $1,045/oz AuEq and AISC of $1,529/oz AuEq(2).
- Record quarterly ore processed of 225,965 tonnes (Figure 2), a 73% increase from Q2 2025 and 59% increase from Q1 2026, with a head grade of 6.7 grams per tonne (“g/t”) AuEq, or 6.2 g/t gold, 0.4% copper and 8.9 g/t silver, with a moderate positive gold grade reconciliation compared to the latest independent mineral resource estimate (September 12, 2023 effective date for Kora and Judd).
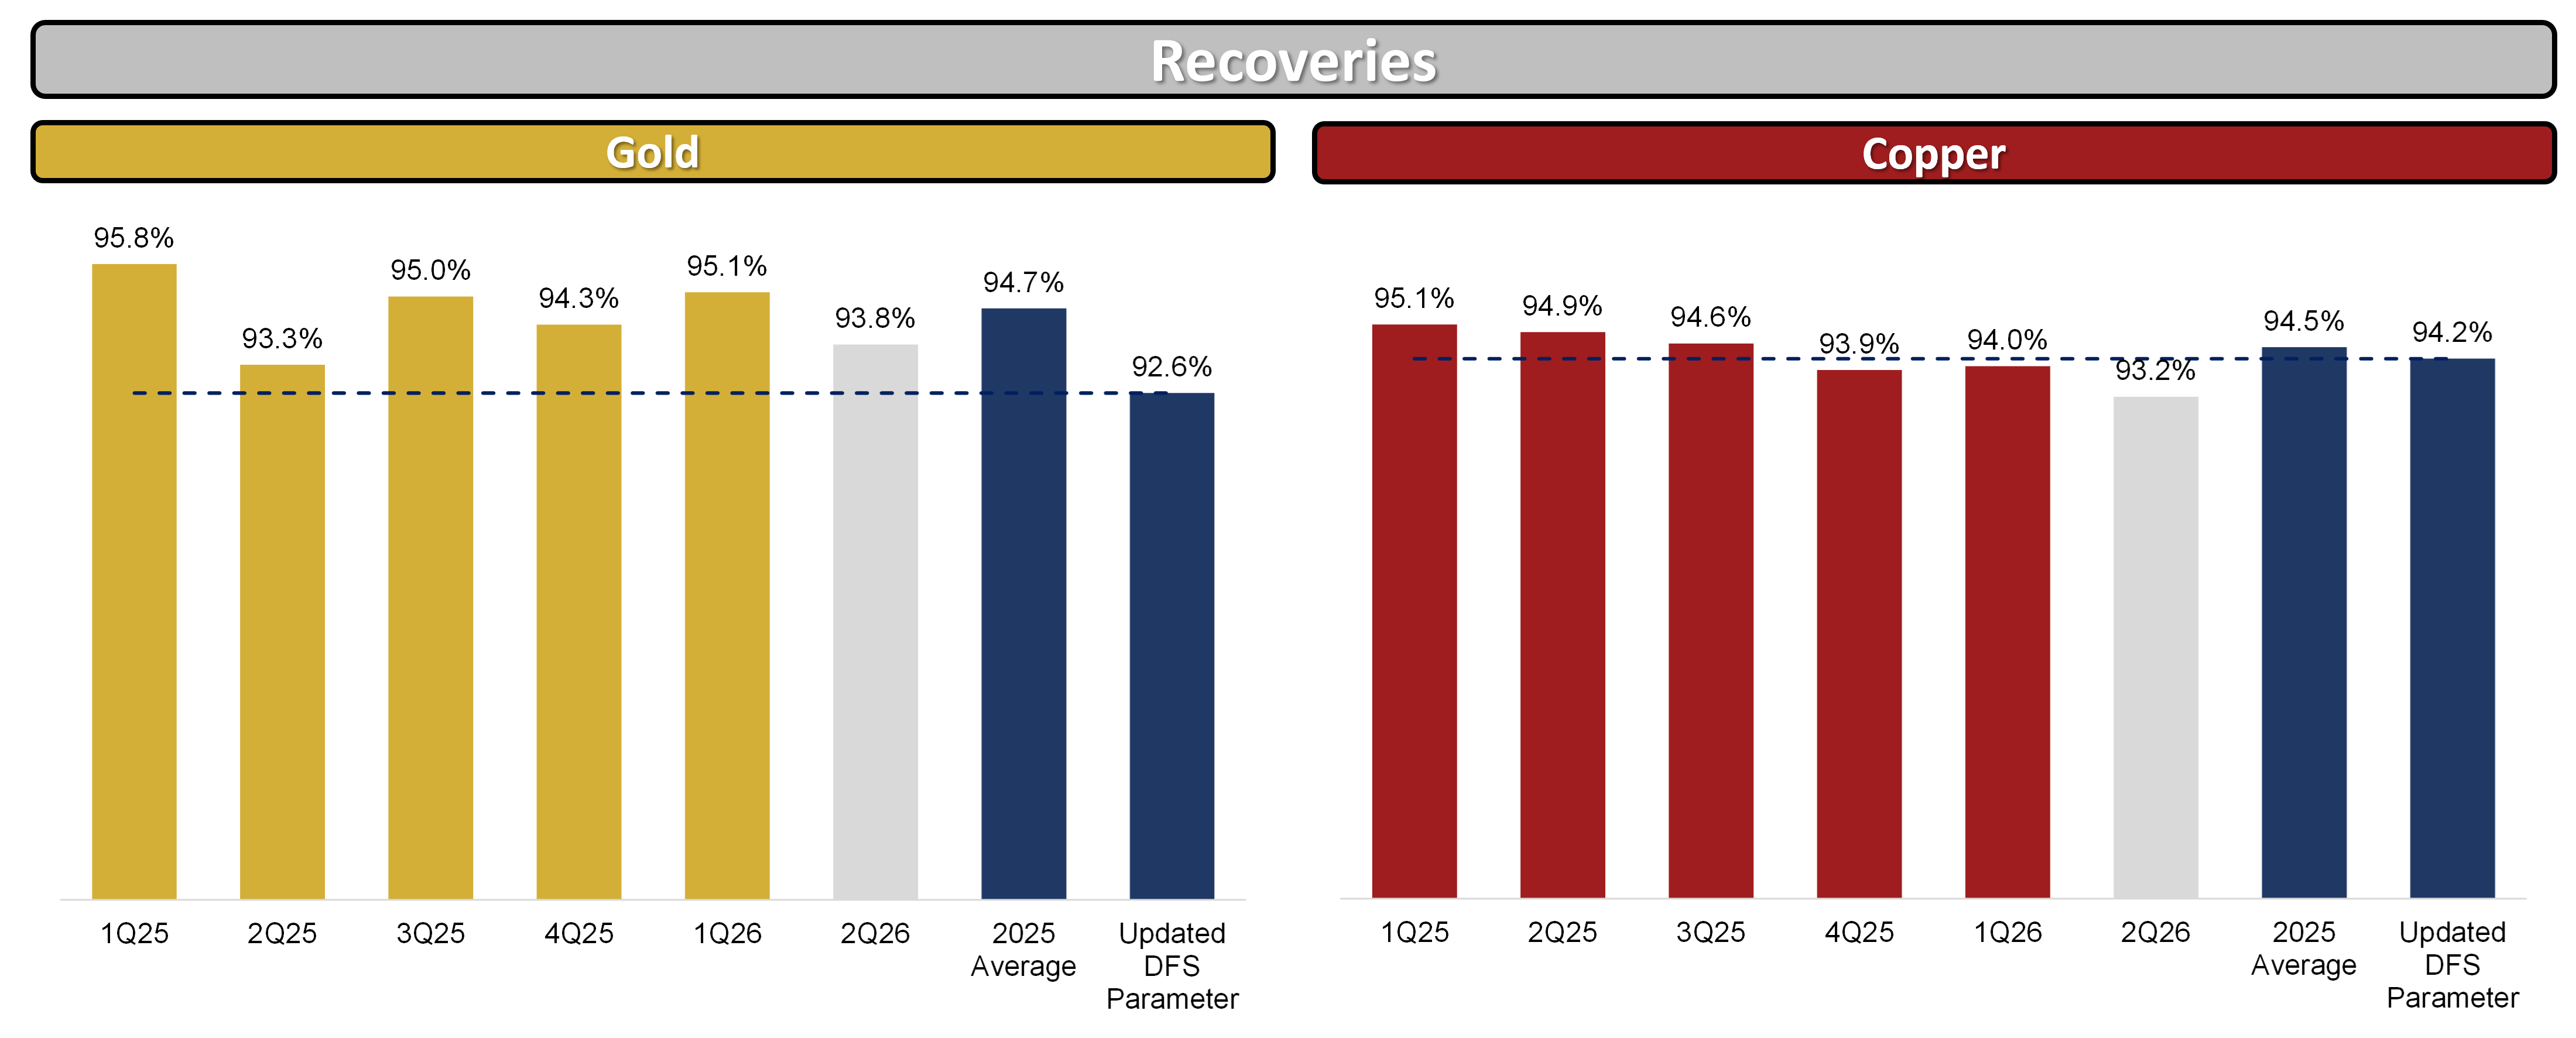
- Strong metallurgical recoveries in Q2 of 93.8% for gold and 93.2% for copper (Figure 3), exceeding the updated definitive feasibility study (“Updated DFS”) recovery parameter for gold of 92.6% for the 9th consecutive quarter (January 1, 2024 effective date). The new 1.2 million tonnes-per-annum Stage 3 Expansion Process Plant has continued to perform well since completion of commissioning, becoming fully operational in December 2025.
- Record quarterly mine development of 3,326 metres (a 35% increase from Q2 2025 and 11% increase from Q1 2026), including a new monthly development record of 1,150 metres achieved in May 2026. Subsequent to quarter end, the Company achieved a new monthly development record of 1,220 metres in July, now exceeding the development requirement of both 1.0 km per month for the Stage 3 Expansion and 1.2 km per month for the Stage 4 Expansion. Importantly, this was achieved ahead of the completion of multiple key enablers scheduled for completion in Q3 (see Growth section below), in addition to the planned arrival of an additional jumbo in late Q4, which will further expand our development fleet.
- Record quarterly total material mined (ore plus waste) of 426,012 tonnes, driven by the positive impact of the introduction and progressive ramp-up of the second mining front during the quarter, as well as continued benefits to material movement capacity from the delivery of key Stage 3 Expansion infrastructure projects, including the second material pass system in June, the internal ramp in Q1, and the Puma Ventilation Drive in Q1.
Financials
- Record cash and cash equivalents totaling US$349.4 million, including a record US$310.0 million net cash position.
- Quarterly revenue of US$205.2 million, an increase of 113% from Q2 2025.
- Quarterly net income of US$84.6 million or US$0.34 per share, an increase of 116% from Q2 2025.
- Operating cash flow (before working capital adjustments) for the three months ended June 30, 2026, of US$105.1 million or US$0.43 per share, and earnings before interest, taxes, depreciation and amortization (“EBITDA”)(2) of US$140.7 million or US$0.57 per share, a 124% and 136% increase from Q2 2025, respectively.
- Sales of 46,682 oz gold, 1,811,181 lbs copper and 49,004 oz silver. Gold concentrate and doré inventory of 9,925 oz as of June 30, 2026, a decrease of 2,393 oz over the prior quarter.
Growth
- As at June 30, 2026, 98% of Stage 3 Expansion growth capital was either spent or committed and remains on budget.
- During Q2, significant progress was made across the key pastefill infrastructure projects:
- At the Surface Tailings Filtration Plant, wet commissioning is well advanced, with performance testing expected to be completed this quarter. At the Surface Paste Binder Blending Area and Filter Cake Storage Facility, civil and concrete works are complete, with structural, mechanical and piping works well advanced across all facilities, and commissioning expected in Q3 2026.
- At the Underground Paste Plant, construction activities across all levels continue to advance rapidly, with concrete works in the Silo Chamber now complete and installation of the silo hopper and other structural works advancing. Remaining civil, structural and mechanical installations are progressing as planned. Commissioning of the Underground Paste Plant, which will complete the pastefill circuit, is planned for Q4 2026.
- During the quarter, several key Stage 3 Expansion underground construction and operational excellence projects were completed or are nearing completion, including:
- Second Material Pass – 5 m diameter, ~200-metre-long material pass completed and operational in June 2026. This is a major milestone for the operation as there are now dedicated, operating ore and waste passes, providing a considerable boost to material handling capabilities in the Main Mine and Lower Kora. The vast majority of material mined underground is now moving through the pass system and hauled to surface via the highly efficient Twin Incline. Development of a third material pass has commenced and is expected to be completed in Q4 2026 to further enhance material handling capabilities.
- Primary Power Station – Phase 2 Power Station Expansion to 15.3 MW (from 10.7 MW) prime power output was completed and fully operational in May 2026. The expanded Primary Power Station now meets Stage 4 Expansion total power requirements and provides increased standby power for any unexpected local hydroelectric grid disruptions.
- Phase 4 Expansion Primary Ventilation Upgrade – Electrical Works progressed during the quarter, with electrification scheduled for completion in Q3 2026. Once commissioned, primary mine airflow capacity is expected to nearly double from approximately 350 m³/s to 600 m³/s (expandable to ~700 m³/s), exceeding the Stage 4 Expansion and life-of-mine ventilation requirements. To conserve power, the variable speed drive fans will initially operate based on mine demand and ramp up incrementally as required. Upon completion, a further reduction in blast clearance times is expected, along with significant additional benefits realized from reconfiguring twin incline traffic to highly productive one-way traffic flow.
- Significant Load and Haulage Fleet Expansion Supporting Increased Material Movement Capacity – Four new Sandvik LH517i underground loaders have been added to date in 2026, resulting in a net increase of two loaders following the replacement of two high-hour units. A larger Sandvik LH621i underground loader is also scheduled to arrive on site in Q4 to further expand the fleet. The haulage fleet is also significantly expanding, with four new 60-tonne surface trucks delivered to site to be operational in late-Q3, and a further four units by year-end – these trucks will haul directly from underground (Twin Incline) to the process plant. In addition, two new Sandvik 45-tonne underground trucks are scheduled to arrive in Q4 as part of the ongoing fleet renewal program.
- Major surface haul road and river crossing infrastructure projects continued to advance during the quarter, highlighted by the completion of the Baupa Bridge in April 2026. Subsequent to Q2, the Kokomo Bridge was completed in late-July and the Kasese River Crossing is expected to be completed in Q3. The delivery of these critical surface infrastructure projects will enable a tripling in surface haulage payload (from 20 tonnes to 60 tonnes), while significantly reducing haulage cycle times. Together, these improvements are expected to support the Stage 3 and Stage 4 Expansion throughput requirements and deliver operating cost efficiencies through economies of scale.
Exploration
- Reported the sixth set of results from the maiden surface diamond drill program at Arakompa, comprising 33 holes and bringing the total number of holes reported to date to 100. All drill holes at Arakompa intersected mineralization, with 40 intersections exceeding 5 g/t AuEq, including 20 exceeding 10 g/t AuEq. Drilling materially expanded and upgraded the near-surface AR1 high-grade zone, now defined over approximately 400 metres of strike and up to 300 metres vertically, beginning approximately 100 metres below surface. The zone has a weighted average grade of 9.47 g/t AuEq and an average true width of 4.32 metres. Drilling also expanded a substantial near-surface bulk-tonnage zone, while surface sampling indicates that mineralization extends to surface along more than two kilometres of strike. Porphyry vector drilling south of Arakompa intersected extensive mineralization and outer potassic alteration, providing an important vector toward a potential high-grade potassic core. K92 is targeting a maiden Arakompa mineral resource estimate in H2 2026. Key highlights include:
- AR1 high-grade zone:
- KARDD0076: 11.90 m at 14.30 g/t AuEq(5) (14.00 g/t Au, 9 g/t Ag, 0.18% Cu), including 1.70 m at 92.43 g/t AuEq (91.55 g/t Au, 44 g/t Ag, 0.35% Cu)
- KARDD0106: 10.00 m at 15.21 g/t AuEq (15.11 g/t Au, 4 g/t Ag, 0.06% Cu), including 4.00 m at 36.65 g/t AuEq (36.50 g/t Au, 6 g/t Ag, 0.09% Cu)
- KARDD0100: 16.50 m at 8.06 g/t AuEq (7.53 g/t Au, 8 g/t Ag, 0.43% Cu)
- AR2 high-grade vein:
- KARDD0084G: 4.70 m at 41.90 g/t AuEq (41.46 g/t Au, 4 g/t Ag, 0.38% Cu)
- KARDD0104: 6.80 m at 15.21 g/t AuEq (15.11 g/t Au, 6 g/t Ag, 0.04% Cu), including 2.00 m at 49.00 g/t AuEq (48.79 g/t Au, 14 g/t Ag, 0.04% Cu)
- KARDD0090: 3.40 m at 20.31 g/t AuEq (20.21 g/t Au, 5 g/t Ag, 0.03% Cu)
- Near-surface bulk-tonnage zone:
- KARDD0076: 99.00 m at 2.90 g/t AuEq (2.76 g/t Au, 4 g/t Ag, 0.09% Cu)
- KARDD0084G: 105.40 m at 2.26 g/t AuEq (2.17 g/t Au, 2 g/t Ag, 0.06% Cu)
- KARDD0090: 106.50 m at 2.22 g/t AuEq (2.11 g/t Au, 3 g/t Ag, 0.07% Cu)
- KARDD0100: 177.55 m at 1.01 g/t AuEq (0.90 g/t Au, 2 g/t Ag, 0.08% Cu)
- Porphyry-style mineralization south of Arakompa:
- KARDD0077: 1,151.20 m at 0.30% CuEq(5) (0.11 g/t Au, 2 g/t Ag, 0.16% Cu)
- KARDD0093G: 800.70 m at 0.33% CuEq (0.14 g/t Au, 1 g/t Ag, 0.17% Cu)
- KARDD0074: 494.00 m at 0.35% CuEq (0.15 g/t Au, 2 g/t Ag, 0.17% Cu)
- See news release dated June 4, 2026 for additional details.
- AR1 high-grade zone:
The Company’s interim consolidated financial statements and associated management’s discussion and analysis for the three months ended June 30, 2026 are available for download on the Company’s website and under the Company’s profile on SEDAR+ (www.sedarplus.ca). All amounts are in U.S. dollars unless otherwise indicated.
See Figure 1: Quarterly Production, Co-Product Cash Cost and Co-Product AISC Chart
See Figure 2: Quarterly Total Ore Processed, Development Metres Advanced and Total Mined Material Chart
See Figure 3: Gold and Copper Recoveries Chart
John Lewins, K92 Chief Executive Officer and Director, stated, “This was another milestone quarter for K92, with multiple record mine physicals achieved, including quarterly lateral development, ore tonnes mined, total material mined and ore tonnes processed. The new 1.2-million-tonnes-per-annum Stage 3 Process Plant continues to perform well, achieving record tonnes milled, and recoveries have continued to exceed the Updated DFS parameters in Q2, which is the second full quarter in which all material was processed exclusively through the new plant.
During the quarter, we also achieved milestones on several key infrastructure projects, including the completion of the second material pass which will provide a considerable boost in material handling capabilities, the completion of the new primary power station to increase power capacity and reliability on site and the completion of the Baupa Bridge, each of which enhances operating efficiency, supports higher mining rates and provides additional capacity for future expansion.
Subsequent to quarter-end, a further monthly development record of 1,220 metres was achieved in July, with development rates steadily above the Stage 3 Expansion requirement of 1,000 metres per month and now exceeding the Stage 4 Expansion requirement of 1,200 metres per month. This performance is particularly encouraging, as it has been achieved ahead of the completion of multiple key expansion enabler projects scheduled over the coming weeks and the planned arrival of an additional jumbo in late Q4, which will further expand our development fleet.
Looking forward, several key expansion enabler projects remain on track for completion this quarter, including the Phase 4 Primary Ventilation Upgrade and haul road and river-crossing upgrades, alongside the continued ramp-up of additional mining fronts. Together with ongoing fleet expansion to increase haulage capacity and the third mining front expected to come online in Q3, initially from Judd, we expect production to be strongest in the second half of the year, with the fourth quarter the strongest, and reiterate our 2026 production guidance.
On exploration, we continue to advance high-priority targets. One new rig arrived on site in early April, with a second additional surface rig currently completing on-site commissioning, which will bring us to up to 16 rigs operating. With our record net cash position, K92 is in a very strong position to deliver the Stage 3 and 4 Expansions while continuing to ramp up our exploration program.”
| Mine Operating Activities | ||
| Three months ended June 30, 2026 | Three months ended June 30, 2025 | |
| Operating data | ||
| Gold head grade (Au g/t) | 6.2 | 8.3 |
| Copper head grade (%) | 0.39% | 0.55% |
| Silver head grade (Ag g/t) | 8.9 | 12.1 |
| Gold equivalent head grade (AuEq g/t) | 6.7 | 8.9 |
| Gold recovery (%) | 93.8% | 93.3% |
| Copper recovery (%) | 93.2% | 94.9% |
| Gold ounces produced | 42,931 | 32,375 |
| Gold ounces equivalent produced(1) (2) | 46,093 | 34,816 |
| Tonnes of copper produced | 808 | 697 |
| Silver ounces produced | 50,109 | 42,824 |
| Financial data (US$’000) | ||
| Gold ounces sold | 46,682 | 28,864 |
| Revenues from concentrate and doré sales | $205,246 | $96,343 |
| Mining, processing and maintenance expenses | $24,129 | $15,578 |
| Other mine expenses | $26,323 | $10,722 |
| Depreciation and depletion | $14,236 | $6,055 |
| Statistics (US$) | ||
| Average realized selling price per ounce, net (3) | $4,493 | $3,166 |
| Cash cost per ounce (net of by-product credit)(2) | $859 | $786 |
| AISC (net of by-product credit)(2) | $1,376 | $1,408 |
| Cash cost per ounce (co-product)(2) | $1,045 | $907 |
| AISC (co-product)(2) | $1,529 | $1,489 |
Notes:
(1) AuEq in Q2 2026 is calculated based on: gold $4,561 per ounce; silver $73.55 per ounce; and copper $6.03 per pound. AuEq in Q2 2025 is calculated based on: gold $3,299 per ounce; silver $33.41 per ounce; and copper $4.31 per pound.
(2) The Company provides some non-international financial reporting standard measures as supplementary information that management believes may be useful to investors to explain the Company’s financial results. Please refer to non-IFRS financial performance measures in the Company’s management’s discussion and analysis dated August 9, 2026, available on SEDAR+ and on the Company’s website, for reconciliation of these measures.
(3) The average realized selling price per ounce is net of metal payabilities for both concentrate and doré.
(4) AuEq exploration results are calculated using longer-term commodity prices with a copper price of US$4.50/lb, a silver price of US$27.50/oz and a gold price of US$2,000/oz. The following recoveries were applied in-line with the Updated Definitive Feasibility Study: Au – 92.6%, Cu – 94.0%, and; Ag – 78.0%.
(5) Drill highlights presented above are core lengths (not true widths).
(6) Gold equivalent (AuEq) and Copper Equivalent (CuEq) exploration results are calculated using longer-term commodity prices with a copper price of US$5.00/lb, a silver price of US$50.00/oz and a gold price of US$3,500/oz. For AuEq, the following recoveries were applied in-line with the Updated Definitive Feasibility Study: Au – 92.6%, Cu – 94.0%, and Ag – 78.0%. For CuEq, Metallurgical recoveries and net smelter returns are not considered.
Mineral resources that are not mineral reserves do not have demonstrated economic viability.
Conference Call and Webcast to Present Results
K92 will host a conference call and webcast to present the 2026 second quarter financial results at 8:30 am (EDT) on Monday, August 10, 2026.
- Listeners may access the conference call by dialing toll-free to 1-833-752-3535 within North America or +1-647-846-8278 from international locations.
The conference call will also be broadcast live (webcast) and may be accessed via the following link: https://event.choruscall.com/mediaframe/webcast.html?webcastid=XOustD1r
Qualified Person
K92 Mine Chief Geologist, Andrew Kohler, PGeo, a qualified person under the meaning of Canadian National Instrument 43-101 – Standards of Disclosure for Mineral Projects, has reviewed and is responsible for the technical content of this news release. Data verification by Mr. Kohler includes significant time onsite reviewing drill core, face sampling, underground workings, and discussing work programs and results with geology and mining personnel.
Technical Report
The Updated DFS and mineral resource estimate for the Kainantu Gold Mine Project in Papua New Guinea is presented in a technical report, titled, “Independent Technical Report, Kainantu Gold Mine, Updated Definitive Feasibility Study, Kainantu Project, Papua New Guinea” dated March 21, 2025, with an effective date of January 1, 2024.
About K92
K92 Mining Inc. is engaged in the production of gold, copper and silver at the Kainantu Gold Mine in the Eastern Highlands province of Papua New Guinea, as well as exploration and development of mineral deposits in the immediate vicinity of the mine. The Company declared commercial production from Kainantu in February 2018, is in a strong financial position, and is working to become a Tier 1 mid-tier producer through ongoing expansions. A maiden resource estimate on the Blue Lake copper-gold porphyry project was completed in August 2022. K92 is operated by a team of mining company professionals with extensive international mine-building and operational experience.
On Behalf of the Company,
John Lewins, Chief Executive Officer and Director
For further information, please contact David Medilek, P.Eng., CFA, President and Chief Operating Officer at +1-604-416-4445
CAUTIONARY STATEMENT REGARDING FORWARD-LOOKING INFORMATION: This news release includes certain “forward-looking statements” under applicable Canadian securities legislation. Such forward-looking statements include, without limitation: (i) the results of the Kainantu Mine Definitive Feasibility Study, including the Stage 3 Expansion, a new standalone 1.2 million tonnes-per-annum process plant and supporting infrastructure; (ii) statements regarding the expansion of the mine and development of any of the deposits; (iii) the Kainantu Stage 4 Expansion, operating two standalone process plants, larger surface infrastructure and mining throughputs; and (iv) the potential extended life of the Kainantu Mine.
All statements in this news release that address events or developments that we expect to occur in the future are forward-looking statements. Forward-looking statements are statements that are not historical facts and are generally, although not always, identified by words such as “expect”, “plan”, “anticipate”, “project”, “target”, “potential”, “schedule”, “forecast”, “budget”, “estimate”, “intend” or “believe” and similar expressions or their negative connotations, or that events or conditions “will”, “would”, “may”, “could”, “should” or “might” occur. All such forward-looking statements are based on the opinions and estimates of management as of the date such statements are made. Forward-looking statements are necessarily based on estimates and assumptions that are inherently subject to known and unknown risks, uncertainties and other factors, many of which are beyond our ability to control, that may cause our actual results, level of activity, performance or achievements to be materially different from those expressed or implied by such forward-looking information. Such factors include, without limitation, Public Health Crises, including the epidemic or pandemic viruses; changes in the price of gold, silver, copper and other metals in the world markets; fluctuations in the price and availability of infrastructure and energy and other commodities; fluctuations in foreign currency exchange rates; volatility in price of our common shares; inherent risks associated with the mining industry, including problems related to weather and climate in remote areas in which certain of the Company’s operations are located; failure to achieve production, cost and other estimates; risks and uncertainties associated with exploration and development; uncertainties relating to estimates of mineral resources including uncertainty that mineral resources may never be converted into mineral reserves; the Company’s ability to carry on current and future operations, including development and exploration activities at the Arakompa, Kora, Judd and other projects; the timing, extent, duration and economic viability of such operations, including any mineral resources or reserves identified thereby; the accuracy and reliability of estimates, projections, forecasts, studies and assessments; the Company’s ability to meet or achieve estimates, projections and forecasts; the availability and cost of inputs; the availability and costs of achieving the Stage 3 Expansion or the Stage 4 Expansion; the ability of the Company to achieve the inputs the price and market for outputs, including gold, silver and copper; failures of information systems or information security threats; political, economic and other risks associated with the Company’s foreign operations; geopolitical events and other uncertainties, such as the conflicts in Ukraine, Israel and Palestine; compliance with various laws and regulatory requirements to which the Company is subject to, including taxation; the ability to obtain timely financing on reasonable terms when required; the current and future social, economic and political conditions, including relationship with the communities in Papua New Guinea and other jurisdictions it operates; other assumptions and factors generally associated with the mining industry; and the risks, uncertainties and other factors referred to in the Company’s Annual Information Form under the heading “Risk Factors”.
Estimates of mineral resources are also forward-looking statements because they constitute projections, based on certain estimates and assumptions, regarding the amount of minerals that may be encountered in the future and/or the anticipated economics of production. The estimation of mineral resources and mineral reserves is inherently uncertain and involves subjective judgments about many relevant factors. Mineral resources that are not mineral reserves do not have demonstrated economic viability. The accuracy of any such estimates is a function of the quantity and quality of available data, and of the assumptions made and judgments used in engineering and geological interpretation, Forward-looking statements are not a guarantee of future performance, and actual results and future events could materially differ from those anticipated in such statements. Although we have attempted to identify important factors that could cause actual results to differ materially from those contained in the forward-looking statements, there may be other factors that cause actual results to differ materially from those that are anticipated, estimated, or intended. There can be no assurance that such statements will prove to be accurate, as actual results and future events could differ materially from those anticipated in such statements. Accordingly, readers should not place undue reliance on forward-looking statements. The Company disclaims any intention or obligation to update or revise any forward-looking statements, whether as a result of new information, future events or otherwise, except as required by law.
Figure 1: Quarterly Production, Co-Product Cash Cost and Co-Product AISC Chart

Figure 2: Quarterly Total Ore Processed, Development Metres Advanced and Total Mined Material Chart
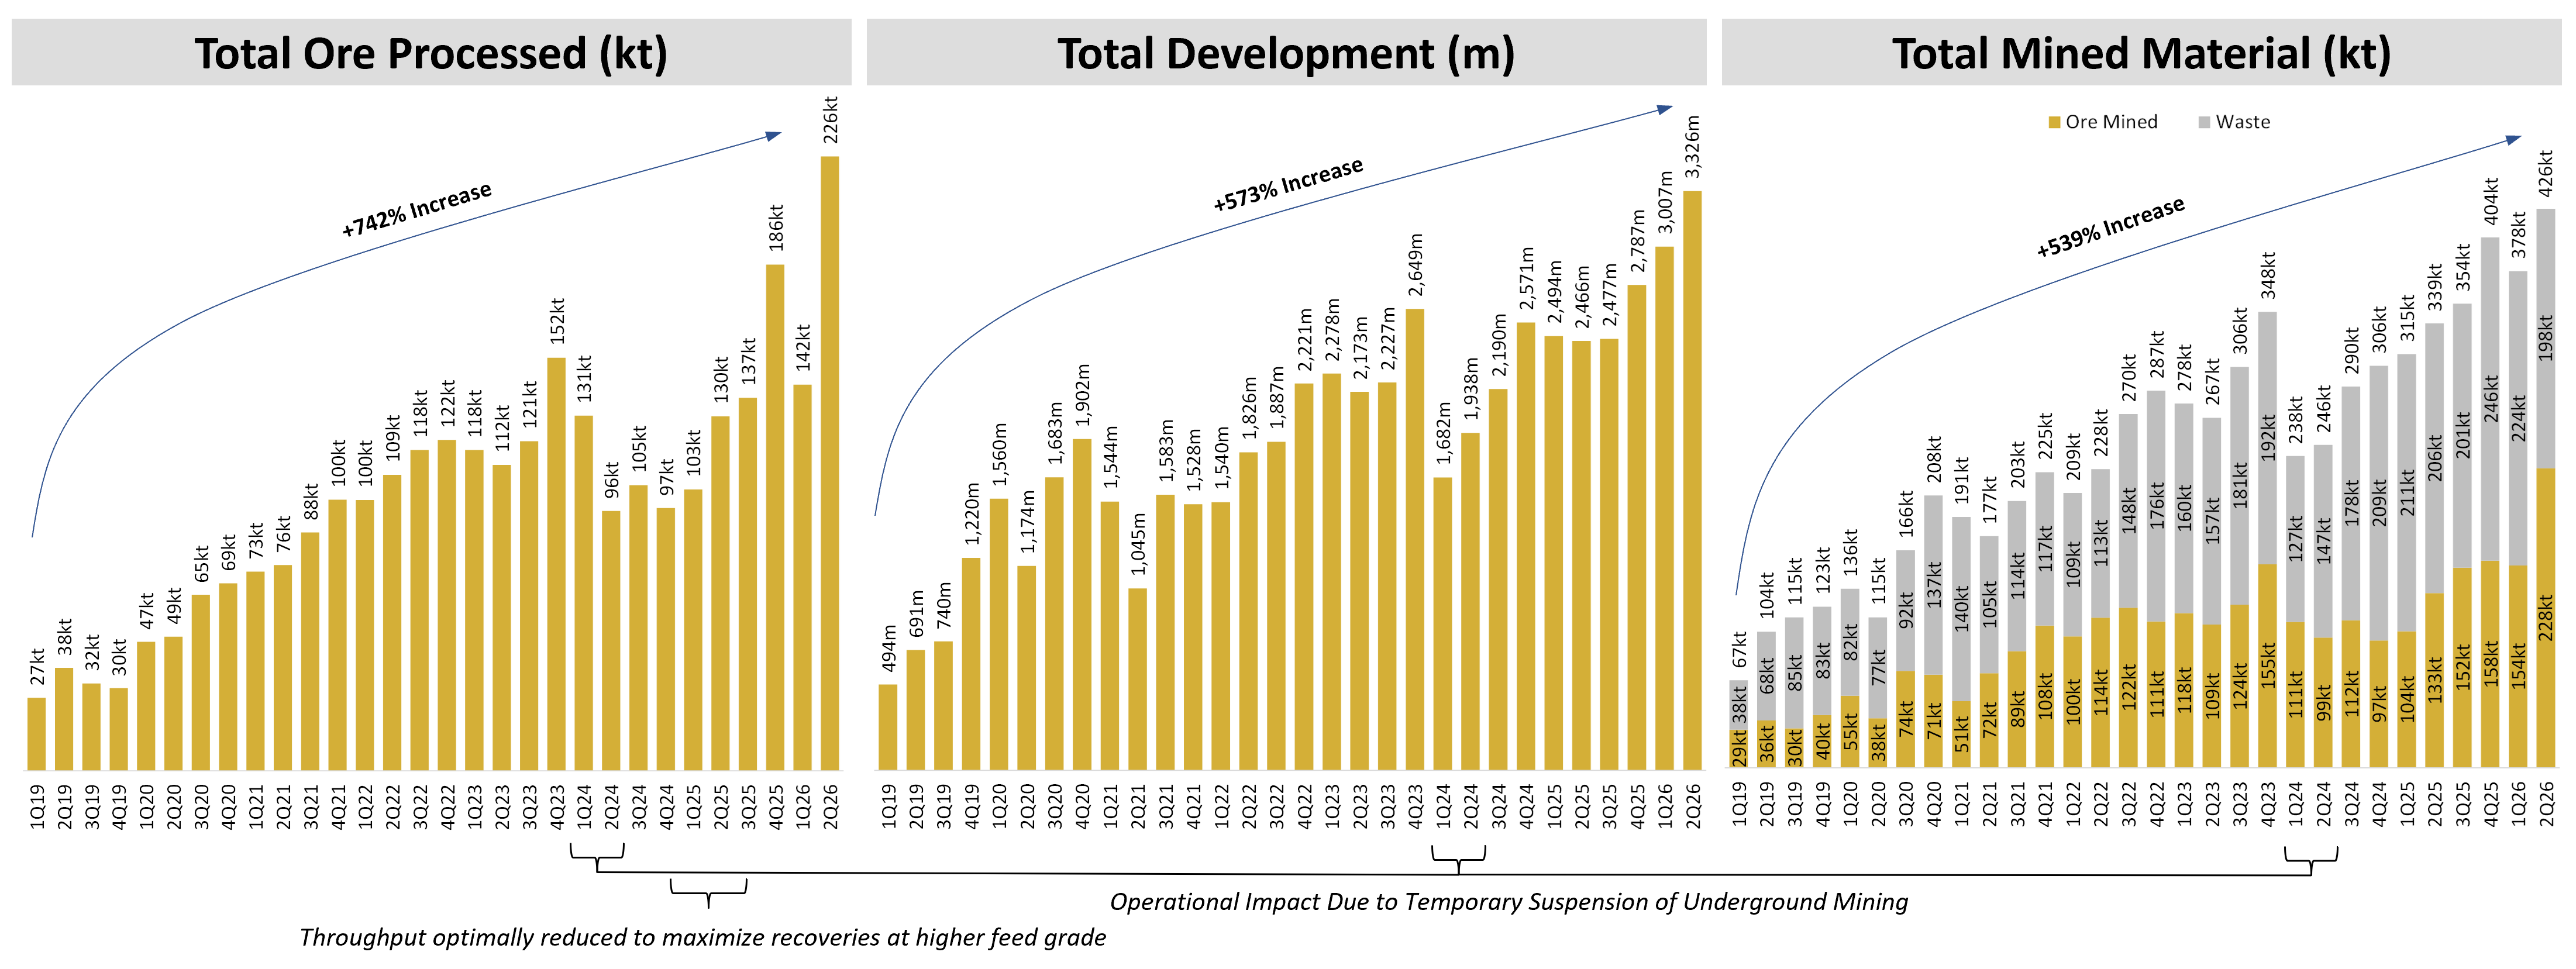
Figure 3: Gold and Copper Recoveries Chart
Photos accompanying this announcement are available at:
https://www.globenewswire.com/NewsRoom/AttachmentNg/374b3eb3-6ab5-46e4-bf61-34698fd17db6
https://www.globenewswire.com/NewsRoom/AttachmentNg/fd04c1a6-3c00-43f2-8611-3545ffa48945
https://www.globenewswire.com/NewsRoom/AttachmentNg/78c0111f-d632-4d17-bf8c-1015e09929f2

