HOMB’s Top-Tier Performance Continues into 2026 with First Quarter Earnings of $118.2 Million, EPS of $0.60 and ROA of 2.09%
CONWAY, Ark., April 15, 2026 (GLOBE NEWSWIRE) — Home BancShares, Inc. (NYSE: HOMB) (“Home” or the “Company”), parent company of Centennial Bank, released quarterly earnings today.
| Quarterly Highlights | |||||
| Metric | Q1 2026 | Q4 2025 | Q3 2025 | Q2 2025 | Q1 2025 |
| Net income | $118.2 million | $118.2 million | $123.6 million | $118.4 million | $115.2 million |
| Net income, as adjusted (non-GAAP)(1) | $118.2 million | $117.9 million | $119.7 million | $114.6 million | $111.9 million |
| Total revenue (net) | $266.7 million | $282.1 million | $277.7 million | $271.0 million | $260.1 million |
| Income before income taxes | $152.2 million | $153.3 million | $159.3 million | $152.0 million | $147.2 million |
| Pre-tax, pre-provision, net income (PPNR) (non-GAAP)(1) | $152.7 million | $167.7 million | $162.8 million | $155.0 million | $147.2 million |
| PPNR, as adjusted (non-GAAP)(1) | $152.7 million | $167.1 million | $157.7 million | $150.4 million | $142.8 million |
| Pre-tax net income to total revenue (net) | 57.08% | 54.35% | 57.38% | 56.08% | 56.58% |
| Pre-tax net income, as adjusted, to total revenue (net) (non-GAAP)(1) | 57.06% | 54.14% | 55.53% | 54.39% | 54.91% |
| P5NR(Pre-tax, pre-provision, profit percentage) (PPNR to total revenue (net)) (non-GAAP)(1) | 57.27% | 59.46% | 58.64% | 57.19% | 56.58% |
| P5NR, as adjusted (non-GAAP)(1) | 57.25% | 59.25% | 56.80% | 55.49% | 54.91% |
| ROA | 2.09% | 2.06% | 2.17% | 2.08% | 2.07% |
| ROA, as adjusted (non-GAAP)(1) | 2.09% | 2.05% | 2.10% | 2.02% | 2.01% |
| NIM | 4.51% | 4.61% | 4.56% | 4.44% | 4.44% |
| Purchase accounting accretion | $1.1 million | $1.3 million | $1.3 million | $1.2 million | $1.4 million |
| ROE | 11.09% | 11.04% | 11.91% | 11.77% | 11.75% |
| ROE, as adjusted (non-GAAP)(1) | 11.08% | 11.01% | 11.54% | 11.39% | 11.41% |
| ROTCE (non-GAAP)(1) | 16.56% | 16.65% | 18.28% | 18.26% | 18.39% |
| ROTCE, as adjusted (non-GAAP)(1) | 16.55% | 16.60% | 17.70% | 17.68% | 17.87% |
| Diluted earnings per share | $0.60 | $0.60 | $0.63 | $0.60 | $0.58 |
| Diluted earnings per share, as adjusted (non-GAAP)(1) | $0.60 | $0.60 | $0.61 | $0.58 | $0.56 |
| Non-performing assets to total assets | 0.97% | 0.55% | 0.56% | 0.60% | 0.56% |
| Common equity tier 1 capital | 16.7% | 16.3% | 16.1% | 15.6% | 15.4% |
| Leverage | 14.3% | 14.1% | 13.8% | 13.4% | 13.3% |
| Tier 1 capital | 16.7% | 16.3% | 16.1% | 15.6% | 15.4% |
| Total risk-based capital | 19.5% | 19.1% | 18.9% | 19.3% | 19.1% |
| Allowance for credit losses to total loans | 1.90% | 1.90% | 1.87% | 1.86% | 1.87% |
| Book value per share | $22.15 | $21.88 | $21.41 | $20.71 | $20.40 |
| Tangible book value per share (non-GAAP)(1) | $14.87 | $14.60 | $14.13 | $13.44 | $13.15 |
| Dividends per share | $0.21 | $0.21 | $0.20 | $0.20 | $0.195 |
| Shareholder buyback yield(2) | 0.25% | 0.27% | 0.18% | 0.49% | 0.53% |
(1) Calculation of this metric and the reconciliation to GAAP are included in the schedules accompanying this release.
(2) Calculation of this metric is included in the schedules accompanying this release.
“HOMB works for the shareholder each and every day. Our strong, consistent philosophy continues to deliver performance results that ranked us #2 in the U.S. on S&P’s banks over $10 billion for the year 2025. During current uncertain economic and geopolitical times, I am very proud that HOMB continues to be a safe place with a strong balance sheet for our customers and shareholders,” said John Allison, Chairman.
| Quarterly Financial Performance Trends | ||
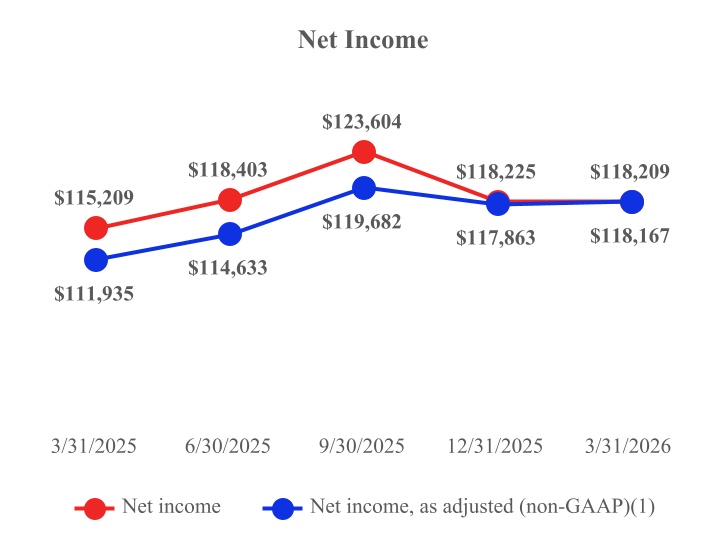
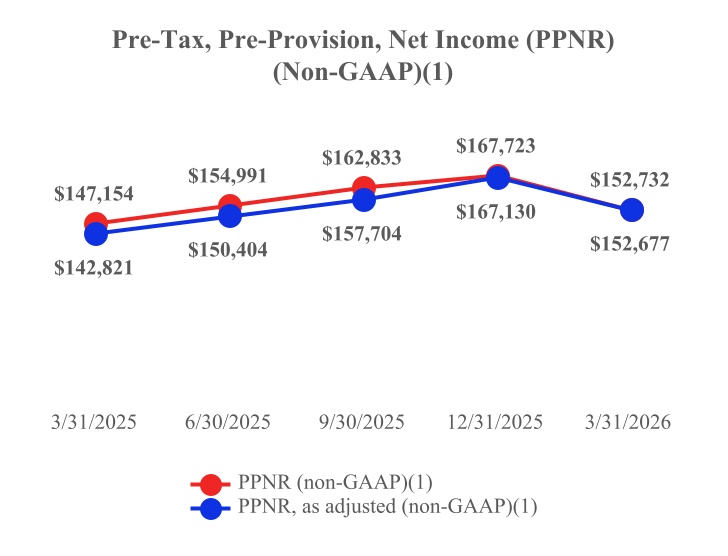
| During the first quarter of 2026, the Company delivered stable and resilient earnings performance, with net income of approximately $118.2 million, consistent with the prior quarter and up year over year. Net income, as adjusted (non‑GAAP)(1), of approximately $118.2 million further reflects the strength and sustainability of underlying operations. | The chart below reflects solid year‑over‑year growth in pre‑tax, pre‑provision net revenue (PPNR) during the first quarter of 2026, reflecting continued strength in operating performance. PPNR totaled approximately $152.7 million, representing an increase of $5.6 million, or 3.8%, compared to the first quarter of 2025. PPNR, as adjusted (non-GAAP)(1), increased $9.9 million, or 6.9%, year over year to approximately $152.7 million, underscoring improved underlying profitability and disciplined expense management. | |
| Dollar amounts presented below in thousands. | ||
 |  | |
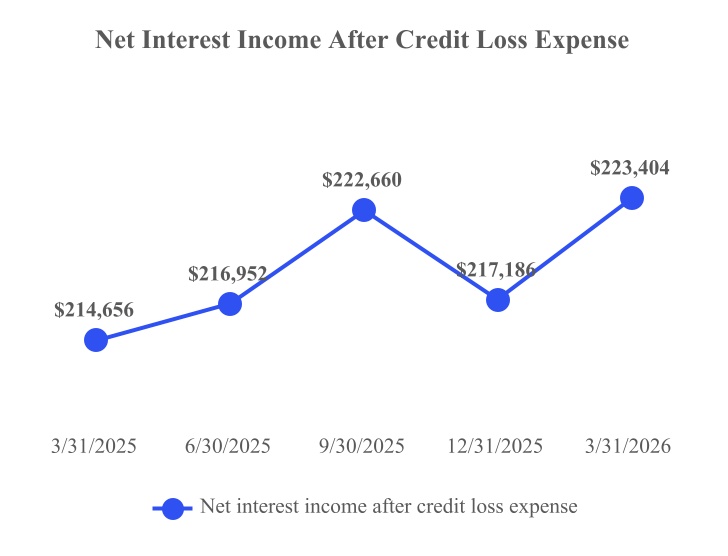
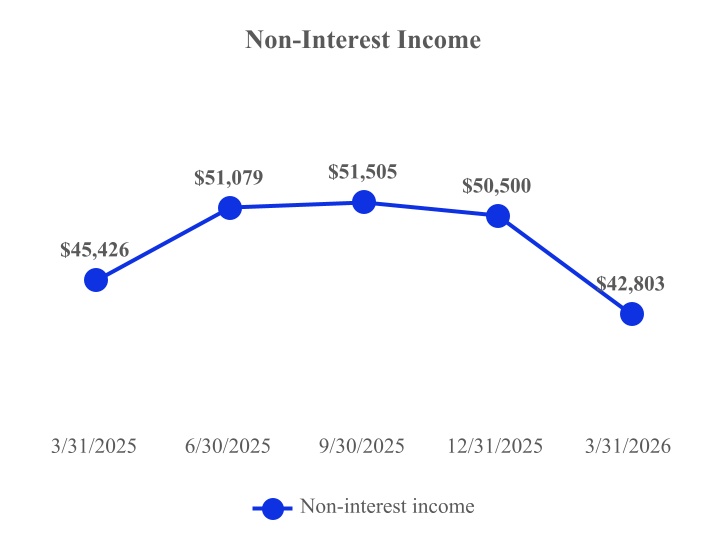
| Net interest income after credit loss expense increased by $6.2 million from Q4 2025 to Q1 2026 and $8.7 million on a year over year basis. These results reflect a generally upward trend throughout the periods presented, supported by effective balance sheet management and stable credit performance. Despite normal quarterly variability, the Company delivered consistent, high‑quality earnings, underscoring the strength and resilience of its net interest income. | Non-interest income was $42.8 million for the first quarter of 2026, reflecting a normalization from the levels experienced in prior quarters, primarily due to certain non-continuing other income items. Results remained supported by a diversified mix of revenue streams, with performance over the prior several quarters demonstrating the Company’s ability to generate stable non‑interest income despite typical quarterly variability. Management continues to emphasize disciplined execution and strategic growth initiatives to support long‑term, sustainable income generation. | |
| Dollar amounts presented below in thousands. | ||
 |  | |
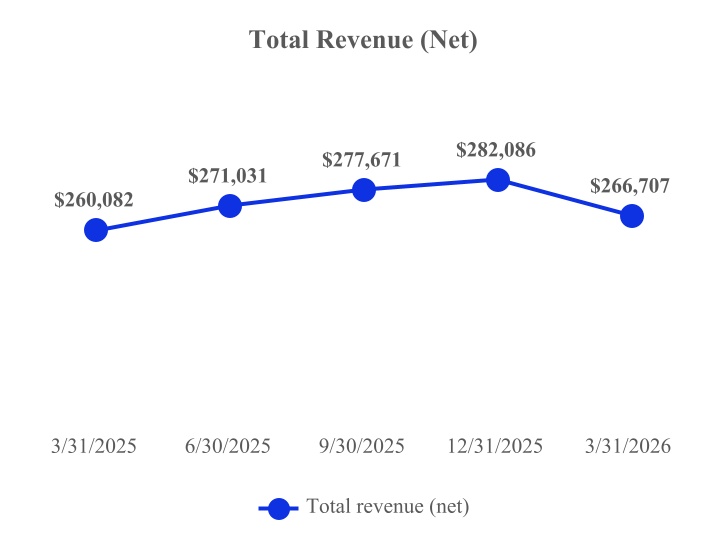
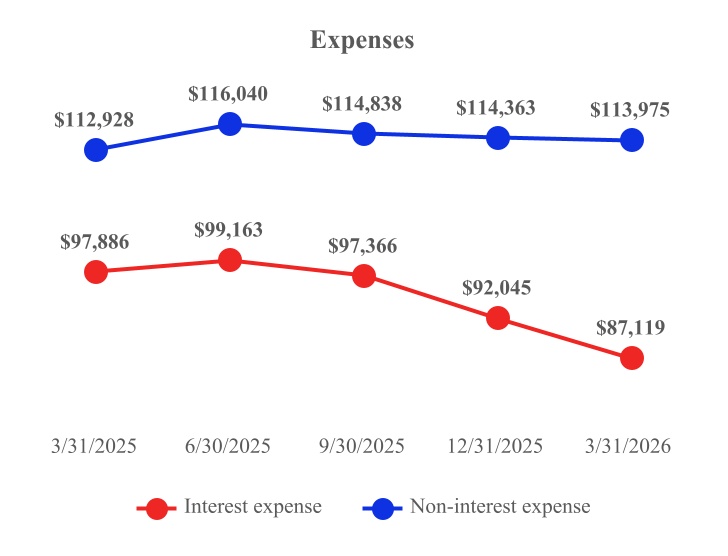
| Total revenue (net) during the first quarter of 2026 was approximately $266.7 million, representing an increase of $6.6 million, or 2.5%, year over year. While revenue moderated from the fourth quarter, results demonstrate the durability of the Company’s revenue base and provide a strong foundation for further growth as 2026 progresses. | During the first quarter of 2026, the Company demonstrated continued expense discipline and effective balance sheet management. Interest expense declined to $87.1 million primarily due to the declining interest rate environment. Non‑interest expense remained well controlled at approximately $114.0 million, consistent with prior quarter levels. Together, these trends highlight the Company’s focus on cost efficiency and operating discipline, supporting strong operating leverage and overall earnings performance. | |
 |  | |
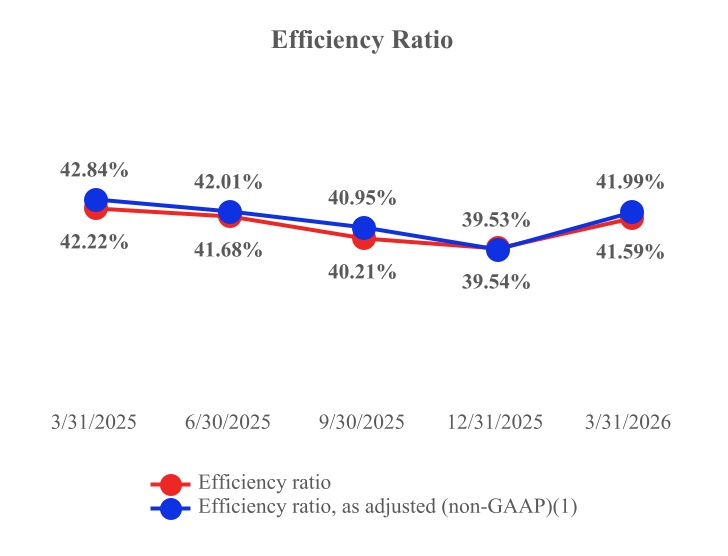
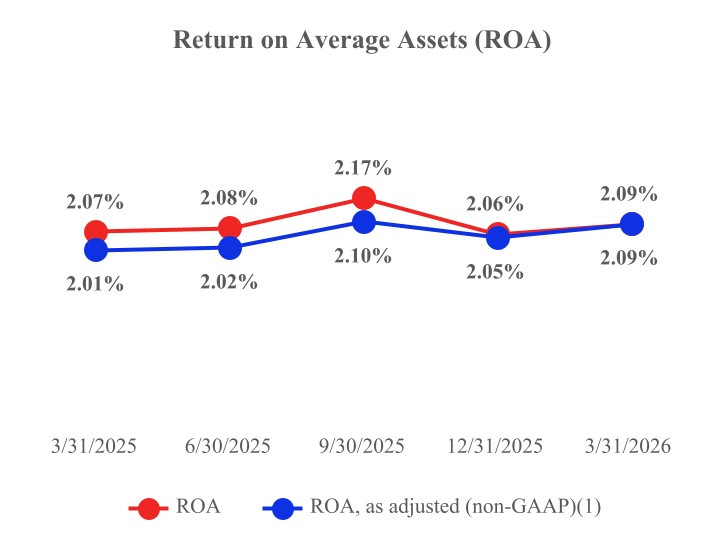
| The Company continued to demonstrate strong operating discipline throughout Q1 2026, posting an efficiency ratio of 41.6%. While modestly higher than the fourth quarter level, the efficiency ratio reflects continued, effective expense management and remains well controlled. The efficiency ratio, as adjusted (non-GAAP)(1), of approximately 42.0% underscores the consistency of underlying operating efficiency, highlighting the Company’s ability to balance investment in growth with disciplined cost management. | The Company delivered strong and improving return on average assets (ROA) during the first quarter of 2026, with an ROA of approximately 2.09%. This performance reflects both a year over year and sequential quarterly increase, underscoring continued balance sheet efficiency and disciplined execution. ROA, as adjusted (non-GAAP)(1), also increased to approximately 2.09%, demonstrating consistent earnings quality and effective asset utilization. Overall, Q1 2026 ROA highlights the Company’s ability to generate attractive returns while maintaining operational and financial stability. | |
 |  |
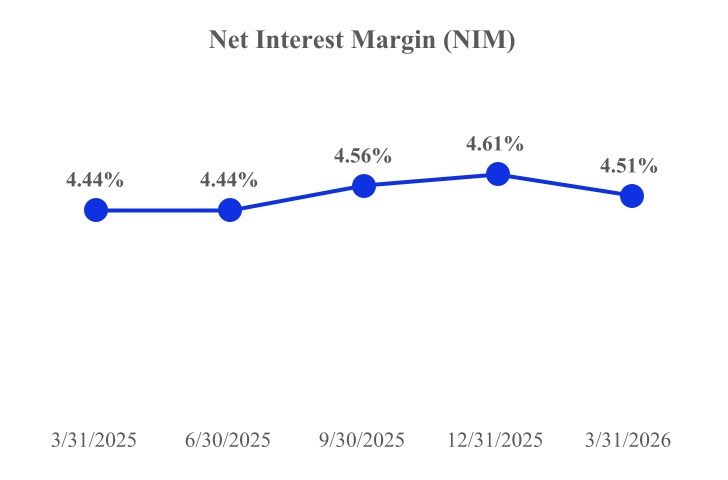
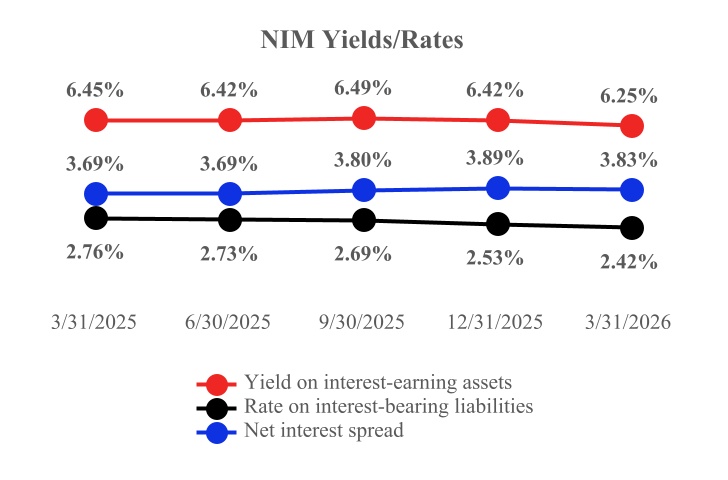
| The tables below present additional key financial metrics over the past five quarters, including net interest margin (NIM), yield on interest-earning assets, rate on interest-bearing liabilities, and net interest spread. These metrics are fundamental indicators of the Company’s profitability and operational efficiency. | ||
 |  | |
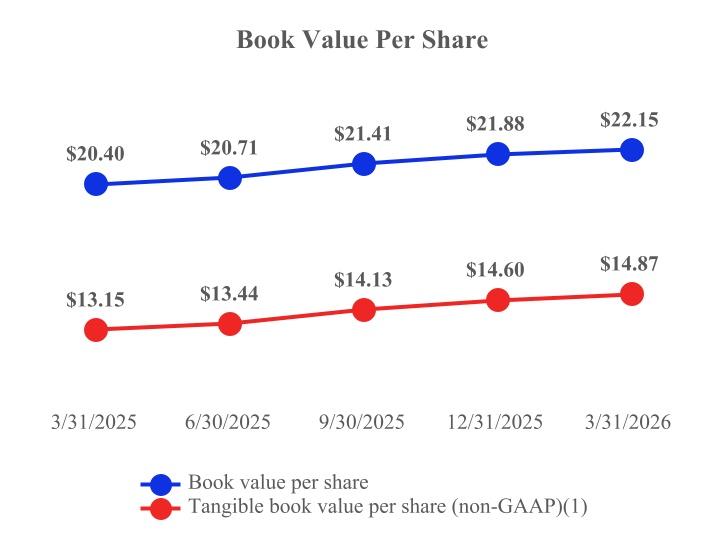
| Book value per share increased to $22.15 at March 31, 2026, representing steady growth from $20.40 at March 31, 2025. Tangible book value per share (non‑GAAP)(1) also rose consistently to $14.87 over the same period. The continued sequential improvement reflects retained earnings growth and disciplined capital management, underscoring the Company’s ability to build shareholder value through a range of operating conditions. Book value per share and tangible book value per share (non-GAAP)(1) as of March 31, 2026 are both records for the Company. | ||
 | ||
| Operating Highlights |
Net income for the three-month period ended March 31, 2026 was $118.2 million, or $0.60 diluted earnings per share. When adjusting for non-fundamental items, net income and diluted earnings per share on an as-adjusted basis (non-GAAP), were $118.2 million(1) and $0.60 per share(1), respectively, for the three months ended March 31, 2026.
Our net interest margin was 4.51% and 4.61% for the three-month periods ended March 31, 2026 and December 31, 2025, respectively. The yield on loans was 7.08% and 7.30% for the three months ended March 31, 2026 and December 31, 2025, respectively, as average loans increased from $15.51 billion to $15.68 billion. The rate on interest bearing deposits decreased to 2.35% as of March 31, 2026, from 2.47% as of December 31, 2025, while average interest-bearing deposits increased from $13.47 billion to $13.66 billion.
During the first quarter of 2026, there was no event interest income compared to $2.6 million of event interest income for the fourth quarter of 2025. The decrease in event income was dilutive to the net interest margin by six basis points. Purchase accounting accretion on acquired loans was $1.1 million and $1.3 million for the three-month periods ended March 31, 2026 and December 31, 2025, respectively, and average purchase accounting loan discounts were $12.5 million and $13.8 million for the three-month periods ended March 31, 2026 and December 31, 2025, respectively.
Net interest income on a fully taxable equivalent basis was $226.6 million for the three-month period ended March 31, 2026, and $233.8 million for the three-month period ended December 31, 2025. This decrease in net interest income for the three-month period ended March 31, 2026, was the result of a $12.2 million decrease in interest income, which was partially offset by a $4.9 million decrease in interest expense. The $12.2 million decrease in interest income was primarily the result of an $11.7 million decrease in loan income and a $1.1 million decrease in income from investments. These reductions were partially offset by a $540,000 increase in income from deposits with other banks. The $4.9 million decrease in interest expense was due to a $4.6 million decrease in interest expense on deposits and a $293,000 decrease in interest expense on FHLB and other borrowed funds.
The Company reported $42.8 million of non-interest income for the first quarter of 2026. The most important components of non-interest income were $10.0 million from service charges on deposit accounts, $9.8 million from other service charges and fees, $9.1 million from other income, $5.5 million from trust fees, $4.4 million in mortgage lending income, $2.5 million from dividends from FHLB, FRB, FNBB and other, and $1.4 million from the increase in cash value of life insurance, which were partially offset by $1.2 million in expense from the fair value adjustment for marketable securities.
Non-interest expense for the first quarter of 2026 was $114.0 million. The most important components of non-interest expense were $63.2 million salaries and employee benefits expense, $26.6 million in other operating expense, $14.9 million in occupancy and equipment expenses, $8.9 million in data processing expenses and $394,000 in merger and acquisition expenses. Included within other expense was the FDIC special assessment credit, which lowered expense by $1.7 million. For the first quarter of 2026, our efficiency ratio was 41.59%, and our efficiency ratio, as adjusted (non-GAAP), was 41.99%(1).
| Financial Condition |
Total loans receivable were $15.63 billion at March 31, 2026, compared to $15.69 billion at December 31, 2025. Total deposits were $17.74 billion at March 31, 2026, compared to $17.48 billion at December 31, 2025. Total assets were $23.20 billion at March 31, 2026, compared to $22.88 billion at December 31, 2025.
During the first quarter of 2026, the Company had a $52.6 million decrease in loans. Our community banking footprint experienced $100.5 million in organic loan decline during the quarter ended March 31, 2026, while Centennial CFG experienced $47.9 million of organic loan growth in the first quarter, with $2.06 billion of loans outstanding at March 31, 2026.
Non-performing loans to total loans were 1.16% and 0.54% at March 31, 2026 and December 31, 2025, respectively. Non-performing assets to total assets were 0.97% and 0.55% at March 31, 2026 and December 31, 2025, respectively. The increase in non-performing loans and assets was primarily due to one loan relationship with a balance of $92.1 million being placed on non-accrual status during the quarter ended March 31, 2026. Net loans charged-off were $1.4 million and $2.5 million for the three months ended March 31, 2026 and December 31, 2025, respectively. The charge-off detail by region for the quarters ended March 31, 2026 and December 31, 2025 can be seen below.
| For the Three Months Ended March 31, 2026 | |||||||||||||||||||||||||||
| (in thousands) | Texas | Arkansas | Centennial CFG | Shore Premier Finance | Florida | Alabama | Total | ||||||||||||||||||||
| Charge-offs | $ | 1,720 | $ | 982 | $ | — | $ | — | $ | 137 | $ | 10 | $ | 2,849 | |||||||||||||
| Recoveries | (788 | ) | (278 | ) | — | (277 | ) | (54 | ) | (3 | ) | (1,400 | ) | ||||||||||||||
| Net charge-offs (recoveries) | $ | 932 | $ | 704 | $ | — | $ | (277 | ) | $ | 83 | $ | 7 | $ | 1,449 | ||||||||||||
| For the Three Months Ended December 31, 2025 | |||||||||||||||||||||||||||
| (in thousands) | Texas | Arkansas | Centennial CFG | Shore Premier Finance | Florida | Alabama | Total | ||||||||||||||||||||
| Charge-offs | $ | 600 | $ | 1,420 | $ | — | $ | 400 | $ | 542 | $ | 101 | $ | 3,063 | |||||||||||||
| Recoveries | (345 | ) | (195 | ) | — | (4 | ) | (49 | ) | (4 | ) | (597 | ) | ||||||||||||||
| Net charge-offs (recoveries) | $ | 255 | $ | 1,225 | $ | — | $ | 396 | $ | 493 | $ | 97 | $ | 2,466 | |||||||||||||
At March 31, 2026, non-performing loans were $182.1 million, and non-performing assets were $224.1 million. At December 31, 2025, non-performing loans were $85.0 million, and non-performing assets were $124.8 million.
The table below shows the non-performing loans and non-performing assets by region as of March 31, 2026:
| (in thousands) | Texas | Arkansas | Centennial CFG | Shore Premier Finance | Florida | Alabama | Total | ||||||||||||||
| Non-accrual loans | $ | 119,333 | $ | 21,833 | $ | 787 | $ | 12,131 | $ | 25,532 | $ | 23 | $ | 179,639 | |||||||
| Loans 90+ days past due | 1,077 | 36 | — | — | 1,368 | — | 2,481 | ||||||||||||||
| Total non-performing loans | 120,410 | 21,869 | 787 | 12,131 | 26,900 | 23 | 182,120 | ||||||||||||||
| Foreclosed assets held for sale | 16,164 | 1,638 | 22,812 | — | 260 | — | 40,874 | ||||||||||||||
| Other non-performing assets | — | — | — | 1,140 | — | — | 1,140 | ||||||||||||||
| Total other non-performing assets | 16,164 | 1,638 | 22,812 | 1,140 | 260 | — | 42,014 | ||||||||||||||
| Total non-performing assets | $ | 136,574 | $ | 23,507 | $ | 23,599 | $ | 13,271 | $ | 27,160 | $ | 23 | $ | 224,134 | |||||||
The table below shows the non-performing loans and non-performing assets by region as December 31, 2025:
| (in thousands) | Texas | Arkansas | Centennial CFG | Shore Premier Finance | Florida | Alabama | Total | ||||||||||||||
| Non-accrual loans | $ | 24,234 | $ | 18,234 | $ | 787 | $ | 10,048 | $ | 24,645 | $ | 54 | $ | 78,002 | |||||||
| Loans 90+ days past due | 2,383 | 291 | — | 3,286 | 1,020 | — | 6,980 | ||||||||||||||
| Total non-performing loans | 26,617 | 18,525 | 787 | 13,334 | 25,665 | 54 | 84,982 | ||||||||||||||
| Foreclosed assets held for sale | 15,988 | 771 | 22,812 | — | 260 | — | 39,831 | ||||||||||||||
| Total other non-performing assets | 15,988 | 771 | 22,812 | — | 260 | — | 39,831 | ||||||||||||||
| Total non-performing assets | $ | 42,605 | $ | 19,296 | $ | 23,599 | $ | 13,334 | $ | 25,925 | $ | 54 | $ | 124,813 | |||||||
The Company’s allowance for credit losses on loans was $297.6 million, or 1.90% of total loans, at both March 31, 2026 and December 31, 2025. As of March 31, 2026 and December 31, 2025, the Company’s allowance for credit losses on loans was 163.43% and 350.17% of its total non-performing loans, respectively.
Shareholders’ equity was $4.35 billion at March 31, 2026, which increased approximately $52.7 million from December 31, 2025. The net increase in shareholders’ equity is primarily associated with the $76.9 million increase in retained earnings. This was partially offset by the $13.5 million decrease in accumulated other comprehensive income and the $13.9 million in stock repurchases for the quarter. Book value per common share was $22.15 at March 31, 2026, compared to $21.88 at December 31, 2025. Tangible book value per common share (non-GAAP) was $14.87(1) at March 31, 2026, compared to $14.60(1) at December 31, 2025. Book value per common share and tangible book value per common share, as of March 31, 2026, were both records for the Company.
| Stock Repurchases and Dividends |
During the three-month period ended March 31, 2026, the Company repurchased 507,622 shares of common stock, which equated to a shareholder buyback yield of 0.25%(2). In comparison, during the three-month period ended December 31, 2025, the Company repurchased 540,706 shares of common stock, which equated to a shareholder buyback yield of 0.27%(2). The Company defines shareholder buyback yield as the percentage of the Company’s market capitalization spent on share repurchases. It reflects how much the Company is returning to the shareholders by reducing the number of outstanding shares, and it is calculated by dividing the Company’s total share repurchase cost for the period by the Company’s total market capitalization at the beginning of the period.
In addition, during the quarter ended March 31, 2026, the Company paid a dividend of $0.21 per share. This cash dividend was consistent with the dividend paid during the fourth quarter of 2025.
| Branches |
The Company currently has 75 branches in Arkansas, 78 branches in Florida, 59 branches in Texas, 8 branches in Tennessee, 5 branches in Alabama and one branch in New York City.
| Acquisition |
Effective April 1, 2026, the Company completed its previously announced acquisition of Mountain Commerce Bancorp, Inc. (“Mountain Commerce” or “MCBI”), parent company of Mountain Commerce Bank, pursuant to the terms of a previously disclosed definitive agreement and plan of merger (the “Merger Agreement”). The acquisition was completed through a series of mergers resulting in Mountain Commerce merging into Home and Mountain Commerce Bank merging into Centennial (collectively, the “Merger”).
Under the terms of the Merger Agreement, Home issued approximately 5.4 million shares of its common stock valued at approximately $146 million as of April 1, 2026, with MCBI shareholders receiving 0.85 shares of Home common stock for each share of MCBI common stock they owned at closing. No cash consideration was paid in connection with the Merger, except for cash paid in lieu of fractional shares of Home common stock, equal to $26.77 multiplied by any resulting fractional shares of Home common stock to which the former MCBI shareholders would have been entitled.
| Conference Call |
Management will conduct a conference call to review this information at 1:00 p.m. CT (2:00 p.m. ET) on Thursday, April 16, 2026. We strongly encourage all participants to pre-register for the conference call webcast or the live call using one of the following links. First, participants can pre-register for the conference call webcast using the following link: https://events.q4inc.com/attendee/401378152. Participants who pre-register will be given a unique webcast link to gain immediate access to the conference call webcast. Second, participants can pre-register for the live call using the following link: https://www.netroadshow.com/events/login/LE9zwo3kRY977wuorjaoPFDRQh4g9LFnhMn. Participants who pre-register will be given the phone number and unique access codes to gain immediate access to the live call. Participants may pre-register now, or at any time prior to the call, and will immediately receive simple instructions via email. The Home BancShares conference call will also be scheduled as an event in your Outlook calendar.
Those without internet access or unable to pre-register may dial in and listen to the live call by calling 1-833-470-1428, Passcode: 493634. A replay of the call will be available by calling 1-866-813-9403, Passcode: 515402, which will be available until April 23, 2026, at 10:59 p.m. CT. Internet access to the call will be available live or in recorded version on the Company’s website at www.homebancshares.com.
| About Home BancShares |
Home BancShares, Inc. is a bank holding company headquartered in Conway, Arkansas. Its wholly-owned subsidiary, Centennial Bank, provides a broad range of commercial and retail banking plus related financial services to businesses, real estate developers, investors, individuals and municipalities. Centennial Bank has branch locations in Arkansas, Florida, Texas, Tennessee, South Alabama and New York City. The Company’s common stock is traded through the New York Stock Exchange under the symbol “HOMB.” The Company was founded in 1998. Visit www.homebancshares.com or www.my100bank.com for more information.
| Non-GAAP Financial Measures |
This press release contains financial information determined by methods other than in accordance with generally accepted accounting principles (GAAP). The Company’s management uses these non-GAAP financial measures–including net income (earnings), as adjusted; pre-tax, pre-provision, net income (PPNR); PPNR, as adjusted; pre-tax net income, as adjusted, to total revenue (net); pre-tax, pre-provision, profit percentage; pre-tax, pre-provision, profit percentage, as adjusted; diluted earnings per common share, as adjusted; return on average assets, as adjusted; return on average assets excluding intangible amortization; return on average assets, as adjusted, excluding intangible amortization; return on average common equity, as adjusted; return on average tangible common equity; return on average tangible common equity, as adjusted; return on average tangible common equity excluding intangible amortization; return on average tangible common equity, as adjusted, excluding intangible amortization; efficiency ratio, as adjusted; tangible book value per common share and tangible common equity to tangible assets–to provide meaningful supplemental information regarding our performance. These measures typically adjust GAAP performance measures to include the tax benefit associated with revenue items that are tax-exempt, as well as adjust income available to common shareholders for certain significant items or transactions that management believes are not indicative of the Company’s primary business operating results. Since the presentation of these GAAP performance measures and their impact differ between companies, management believes presentations of these non-GAAP financial measures provide useful supplemental information that is essential to a proper understanding of the operating results of the Company’s business. These non-GAAP disclosures should not be viewed as a substitute for operating results determined in accordance with GAAP, nor are they necessarily comparable to non-GAAP performance measures that may be presented by other companies. Where non-GAAP financial measures are used, the comparable GAAP financial measure, as well as the reconciliation to the comparable GAAP financial measure, can be found in the tables of this release.
(1) Calculation of this metric and the reconciliation to GAAP are included in the schedules accompanying this release.
(2) Calculation of this metric is included in the schedules accompanying this release.
| General |
This release contains forward-looking statements regarding the Company’s plans, expectations, goals and outlook for the future, including future financial results. Statements in this press release that are not historical facts should be considered forward-looking statements within the meaning of the Private Securities Litigation Reform Act of 1995. Forward-looking statements are not guarantees of future events, performance or results. When we use words or phrases like “may,” “will,” “plan,” “propose,” “contemplate,” “anticipate,” “believe,” “intend,” “continue,” “expect,” “project,” “predict,” “estimate,” “could,” “should,” “would” and similar expressions, you should consider them as identifying forward-looking statements, although we may use other phrasing. Forward-looking statements of this type speak only as of the date of this news release. By nature, forward-looking statements involve inherent risks and uncertainties. Various factors could cause actual results to differ materially from those contemplated by the forward-looking statements. These factors include, but are not limited to, the following: economic conditions, credit quality, interest rates, loan demand, real estate values and unemployment, including any future impacts from inflation or changes in tariffs or trade policies; the risk that the anticipated benefits from the completed acquisition may not be fully realized or may take longer to realize than expected, including as a result of changes in general economic and market conditions, interest and exchange rates, monetary policy, laws and regulations and their enforcement, and the degree of competition in the geographic and business areas in which Home and MCBI operate; the ability to promptly and effectively integrate the businesses of Home and MCBI; the ability to retain key employees, customers and business relationships following the acquisition; the reaction to the completed acquisition of the companies’ customers, employees and counterparties; diversion of management time on integration-related issues; the possibility that the costs of integration may be greater than anticipated; the effect of any future mergers, acquisitions or other transactions to which we or our bank subsidiary may from time to time be a party, including as a result of one or more of the factors described above as they would relate to such transaction; the ability to identify, complete and successfully integrate additional acquisitions; the availability of and access to capital and liquidity on terms acceptable to us; legislative and regulatory changes and risks and expenses associated with current and future legislation and regulations; technological changes and cybersecurity risks and incidents; the effects of changes in accounting policies and practices; changes in governmental monetary and fiscal policies; the impacts of political instability, ongoing or future military conflicts and other major domestic or international events; the impacts of recent or future adverse weather events, including hurricanes, and other natural disasters; competition from other financial institutions; potential claims, expenses and other adverse effects related to current or future litigation, regulatory examinations or other government actions; potential increases in deposit insurance assessments, increased regulatory scrutiny or market disruptions resulting from financial challenges in the banking industry; disruptions, uncertainties and related effects on credit quality, liquidity and other aspects of our business and operations that may result from any future public health crises; changes in the assumptions used in making the forward-looking statements; and other factors described in reports we file with the Securities and Exchange Commission (the “SEC”), including those factors set forth in our Annual Report on Form 10-K for the year ended December 31, 2025, filed with the SEC on February 27, 2026. Home assumes no obligation to update the information in this press release, except as otherwise required by law.
FOR MORE INFORMATION CONTACT:
Donna Townsell
Director of Investor Relations
Home BancShares, Inc.
(501) 328-4625
| Home BancShares, Inc. | ||||||||||||||||||||
| Consolidated End of Period Balance Sheets | ||||||||||||||||||||
| (Unaudited) | ||||||||||||||||||||
| (In thousands) | Mar. 31, 2026 | Dec. 31, 2025 | Sep. 30, 2025 | Jun. 30, 2025 | Mar. 31, 2025 | |||||||||||||||
| ASSETS | ||||||||||||||||||||
| Cash and due from banks | $ | 296,209 | $ | 237,224 | $ | 284,750 | $ | 291,344 | $ | 319,747 | ||||||||||
| Interest-bearing deposits with other banks | 815,714 | 430,113 | 516,170 | 809,729 | 975,983 | |||||||||||||||
| Cash and cash equivalents | 1,111,923 | 667,337 | 800,920 | 1,101,073 | 1,295,730 | |||||||||||||||
| Federal funds sold | 6,025 | 3,000 | 3,625 | 2,600 | 6,275 | |||||||||||||||
| Investment securities – available-for-sale, net of allowance for credit losses | 2,803,847 | 2,871,931 | 2,924,496 | 2,899,968 | 3,003,320 | |||||||||||||||
| Investment securities – held-to-maturity, net of allowance for credit losses | 1,256,635 | 1,259,262 | 1,264,200 | 1,265,292 | 1,269,896 | |||||||||||||||
| Total investment securities | 4,060,482 | 4,131,193 | 4,188,696 | 4,165,260 | 4,273,216 | |||||||||||||||
| Loans receivable | 15,633,628 | 15,686,209 | 15,285,972 | 15,180,624 | 14,952,116 | |||||||||||||||
| Allowance for credit losses | (297,634 | ) | (297,583 | ) | (285,649 | ) | (281,869 | ) | (279,944 | ) | ||||||||||
| Loans receivable, net | 15,335,994 | 15,388,626 | 15,000,323 | 14,898,755 | 14,672,172 | |||||||||||||||
| Bank premises and equipment, net | 374,010 | 369,324 | 374,515 | 379,729 | 384,843 | |||||||||||||||
| Foreclosed assets held for sale | 40,874 | 39,831 | 41,263 | 41,529 | 39,680 | |||||||||||||||
| Cash value of life insurance | 221,830 | 220,469 | 219,075 | 218,113 | 221,621 | |||||||||||||||
| Accrued interest receivable | 106,628 | 108,939 | 110,702 | 107,732 | 115,983 | |||||||||||||||
| Deferred tax asset, net | 143,987 | 148,022 | 155,963 | 174,323 | 170,120 | |||||||||||||||
| Goodwill | 1,398,253 | 1,398,253 | 1,398,253 | 1,398,253 | 1,398,253 | |||||||||||||||
| Core deposit intangible | 30,355 | 32,293 | 34,231 | 36,255 | 38,280 | |||||||||||||||
| Other assets | 371,318 | 374,592 | 380,236 | 383,400 | 376,030 | |||||||||||||||
| Total assets | $ | 23,201,679 | $ | 22,881,879 | $ | 22,707,802 | $ | 22,907,022 | $ | 22,992,203 | ||||||||||
| LIABILITIES AND SHAREHOLDERS’ EQUITY | ||||||||||||||||||||
| Liabilities | ||||||||||||||||||||
| Deposits: | ||||||||||||||||||||
| Demand and non-interest-bearing | $ | 3,994,217 | $ | 3,868,405 | $ | 3,880,101 | $ | 4,024,574 | $ | 4,079,289 | ||||||||||
| Savings and interest-bearing transaction accounts | 11,971,866 | 11,792,828 | 11,500,921 | 11,571,949 | 11,586,106 | |||||||||||||||
| Time deposits | 1,772,192 | 1,818,724 | 1,946,674 | 1,891,909 | 1,876,096 | |||||||||||||||
| Total deposits | 17,738,275 | 17,479,957 | 17,327,696 | 17,488,432 | 17,541,491 | |||||||||||||||
| Securities sold under agreements to repurchase | 157,409 | 155,803 | 145,998 | 140,813 | 161,401 | |||||||||||||||
| FHLB and other borrowed funds | 500,250 | 500,250 | 550,500 | 550,500 | 600,500 | |||||||||||||||
| Accrued interest payable and other liabilities | 176,727 | 169,733 | 189,551 | 203,004 | 207,154 | |||||||||||||||
| Subordinated debentures | 279,433 | 279,265 | 279,093 | 438,957 | 439,102 | |||||||||||||||
| Total liabilities | 18,852,094 | 18,585,008 | 18,492,838 | 18,821,706 | 18,949,648 | |||||||||||||||
| Shareholders’ equity | ||||||||||||||||||||
| Common stock | 1,964 | 1,964 | 1,969 | 1,972 | 1,982 | |||||||||||||||
| Capital surplus | 2,191,243 | 2,201,923 | 2,214,211 | 2,221,576 | 2,246,312 | |||||||||||||||
| Retained earnings | 2,335,787 | 2,258,871 | 2,181,911 | 2,097,712 | 2,018,801 | |||||||||||||||
| Accumulated other comprehensive loss | (179,409 | ) | (165,887 | ) | (183,127 | ) | (235,944 | ) | (224,540 | ) | ||||||||||
| Total shareholders’ equity | 4,349,585 | 4,296,871 | 4,214,964 | 4,085,316 | 4,042,555 | |||||||||||||||
| Total liabilities and shareholders’ equity | $ | 23,201,679 | $ | 22,881,879 | $ | 22,707,802 | $ | 22,907,022 | $ | 22,992,203 | ||||||||||
| Home BancShares, Inc. | ||||||||||||||||||||||||||||
| Consolidated Statements of Income | ||||||||||||||||||||||||||||
| (Unaudited) | ||||||||||||||||||||||||||||
| Quarter Ended | Three Months Ended | |||||||||||||||||||||||||||
| (In thousands) | Mar. 31, 2026 | Dec. 31, 2025 | Sep. 30, 2025 | Jun. 30, 2025 | Mar. 31, 2025 | Mar. 31, 2026 | Mar. 31, 2025 | |||||||||||||||||||||
| Interest income: | ||||||||||||||||||||||||||||
| Loans | $ | 273,473 | $ | 285,491 | $ | 283,165 | $ | 276,041 | $ | 270,784 | $ | 273,473 | $ | 270,784 | ||||||||||||||
| Investment securities | ||||||||||||||||||||||||||||
| Taxable | 24,728 | 25,860 | 26,326 | 26,444 | 27,433 | 24,728 | 27,433 | |||||||||||||||||||||
| Tax-exempt | 7,829 | 7,834 | 7,743 | 7,626 | 7,650 | 7,829 | 7,650 | |||||||||||||||||||||
| Deposits – other banks | 4,945 | 4,405 | 6,242 | 8,951 | 6,620 | 4,945 | 6,620 | |||||||||||||||||||||
| Federal funds sold | 48 | 41 | 56 | 53 | 55 | 48 | 55 | |||||||||||||||||||||
| Total interest income | 311,023 | 323,631 | 323,532 | 319,115 | 312,542 | 311,023 | 312,542 | |||||||||||||||||||||
| Interest expense: | ||||||||||||||||||||||||||||
| Interest on deposits | 79,145 | 83,739 | 87,962 | 88,489 | 86,786 | 79,145 | 86,786 | |||||||||||||||||||||
| FHLB and other borrowed funds | 4,692 | 4,985 | 5,378 | 5,539 | 5,902 | 4,692 | 5,902 | |||||||||||||||||||||
| Securities sold under agreements to repurchase | 927 | 962 | 1,019 | 1,012 | 1,074 | 927 | 1,074 | |||||||||||||||||||||
| Subordinated debentures | 2,355 | 2,359 | 3,007 | 4,123 | 4,124 | 2,355 | 4,124 | |||||||||||||||||||||
| Total interest expense | 87,119 | 92,045 | 97,366 | 99,163 | 97,886 | 87,119 | 97,886 | |||||||||||||||||||||
| Net interest income | 223,904 | 231,586 | 226,166 | 219,952 | 214,656 | 223,904 | 214,656 | |||||||||||||||||||||
| Provision for credit losses on loans | 1,500 | 14,400 | 6,700 | 3,000 | — | 1,500 | — | |||||||||||||||||||||
| Recovery of credit losses on unfunded commitments | (1,000 | ) | — | (1,000 | ) | — | — | (1,000 | ) | — | ||||||||||||||||||
| Recovery of credit losses on investment securities | — | — | (2,194 | ) | — | — | — | — | ||||||||||||||||||||
| Total credit loss expense | 500 | 14,400 | 3,506 | 3,000 | — | 500 | — | |||||||||||||||||||||
| Net interest income after credit loss expense | 223,404 | 217,186 | 222,660 | 216,952 | 214,656 | 223,404 | 214,656 | |||||||||||||||||||||
| Non-interest income: | ||||||||||||||||||||||||||||
| Service charges on deposit accounts | 10,007 | 10,480 | 10,486 | 9,552 | 9,650 | 10,007 | 9,650 | |||||||||||||||||||||
| Other service charges and fees | 9,810 | 11,148 | 12,130 | 12,643 | 10,689 | 9,810 | 10,689 | |||||||||||||||||||||
| Trust fees | 5,482 | 5,121 | 4,600 | 5,234 | 4,760 | 5,482 | 4,760 | |||||||||||||||||||||
| Mortgage lending income | 4,430 | 4,680 | 4,691 | 4,780 | 3,599 | 4,430 | 3,599 | |||||||||||||||||||||
| Insurance commissions | 536 | 460 | 574 | 589 | 535 | 536 | 535 | |||||||||||||||||||||
| Increase in cash value of life insurance | 1,368 | 1,400 | 1,404 | 1,415 | 1,842 | 1,368 | 1,842 | |||||||||||||||||||||
| Dividends from FHLB, FRB, FNBB & other | 2,536 | 2,678 | 2,658 | 2,657 | 2,718 | 2,536 | 2,718 | |||||||||||||||||||||
| Gain on SBA loans | 80 | 308 | 46 | — | 288 | 80 | 288 | |||||||||||||||||||||
| (Loss) gain on branches, equipment and other assets, net | (7 | ) | 11 | (66 | ) | 972 | (163 | ) | (7 | ) | (163 | ) | ||||||||||||||||
| Gain (loss) on OREO, net | 707 | 203 | (1 | ) | 13 | (376 | ) | 707 | (376 | ) | ||||||||||||||||||
| Fair value adjustment for marketable securities | (1,248 | ) | 1,173 | 1,020 | (238 | ) | 442 | (1,248 | ) | 442 | ||||||||||||||||||
| Other income | 9,102 | 12,838 | 13,963 | 13,462 | 11,442 | 9,102 | 11,442 | |||||||||||||||||||||
| Total non-interest income | 42,803 | 50,500 | 51,505 | 51,079 | 45,426 | 42,803 | 45,426 | |||||||||||||||||||||
| Non-interest expense: | ||||||||||||||||||||||||||||
| Salaries and employee benefits | 63,236 | 62,891 | 63,804 | 64,318 | 61,855 | 63,236 | 61,855 | |||||||||||||||||||||
| Occupancy and equipment | 14,867 | 14,434 | 14,828 | 14,023 | 14,425 | 14,867 | 14,425 | |||||||||||||||||||||
| Data processing expense | 8,884 | 8,653 | 8,871 | 8,364 | 8,558 | 8,884 | 8,558 | |||||||||||||||||||||
| Merger and acquisition expenses | 394 | 580 | — | — | — | 394 | — | |||||||||||||||||||||
| Other operating expenses | 26,594 | 27,805 | 27,335 | 29,335 | 28,090 | 26,594 | 28,090 | |||||||||||||||||||||
| Total non-interest expense | 113,975 | 114,363 | 114,838 | 116,040 | 112,928 | 113,975 | 112,928 | |||||||||||||||||||||
| Income before income taxes | 152,232 | 153,323 | 159,327 | 151,991 | 147,154 | 152,232 | 147,154 | |||||||||||||||||||||
| Income tax expense | 34,023 | 35,098 | 35,723 | 33,588 | 31,945 | 34,023 | 31,945 | |||||||||||||||||||||
| Net income | $ | 118,209 | $ | 118,225 | $ | 123,604 | $ | 118,403 | $ | 115,209 | $ | 118,209 | $ | 115,209 | ||||||||||||||
| Home BancShares, Inc. | ||||||||||||||||||||||||||||
| Selected Financial Information | ||||||||||||||||||||||||||||
| (Unaudited) | ||||||||||||||||||||||||||||
| Quarter Ended | Three Months Ended | |||||||||||||||||||||||||||
| (Dollars and shares in thousands, except per share data) | Mar. 31, 2026 | Dec. 31, 2025 | Sep. 30, 2025 | Jun. 30, 2025 | Mar. 31, 2025 | Mar. 31, 2026 | Mar. 31, 2025 | |||||||||||||||||||||
| PER SHARE DATA | ||||||||||||||||||||||||||||
| Diluted earnings per common share | $ | 0.60 | $ | 0.60 | $ | 0.63 | $ | 0.60 | $ | 0.58 | $ | 0.60 | $ | 0.58 | ||||||||||||||
| Diluted earnings per common share, as adjusted (non-GAAP)(1) | 0.60 | 0.60 | 0.61 | 0.58 | 0.56 | 0.60 | 0.56 | |||||||||||||||||||||
| Basic earnings per common share | 0.60 | 0.60 | 0.63 | 0.60 | 0.58 | 0.60 | 0.58 | |||||||||||||||||||||
| Dividends per share – common | 0.21 | 0.21 | 0.20 | 0.20 | 0.195 | 0.21 | 0.195 | |||||||||||||||||||||
| Shareholder buyback yield(2) | 0.25 | % | 0.27 | % | 0.18 | % | 0.49 | % | 0.53 | % | 0.25 | % | 0.53 | % | ||||||||||||||
| Book value per common share | $ | 22.15 | $ | 21.88 | $ | 21.41 | $ | 20.71 | $ | 20.40 | $ | 22.15 | $ | 20.40 | ||||||||||||||
| Tangible book value per common share (non-GAAP)(1) | 14.87 | 14.60 | 14.13 | 13.44 | 13.15 | 14.87 | 13.15 | |||||||||||||||||||||
| STOCK INFORMATION | ||||||||||||||||||||||||||||
| Average common shares outstanding | 196,528 | 196,553 | 197,078 | 197,532 | 198,657 | 196,528 | 198,657 | |||||||||||||||||||||
| Average diluted shares outstanding | 196,733 | 196,764 | 197,288 | 197,765 | 198,852 | 196,733 | 198,852 | |||||||||||||||||||||
| End of period common shares outstanding | 196,394 | 196,357 | 196,889 | 197,239 | 198,206 | 196,394 | 198,206 | |||||||||||||||||||||
| ANNUALIZED PERFORMANCE METRICS | ||||||||||||||||||||||||||||
| Return on average assets (ROA) | 2.09 | % | 2.06 | % | 2.17 | % | 2.08 | % | 2.07 | % | 2.09 | % | 2.07 | % | ||||||||||||||
| Return on average assets, as adjusted: (ROA, as adjusted) (non-GAAP)(1) | 2.09 | % | 2.05 | % | 2.10 | % | 2.02 | % | 2.01 | % | 2.09 | % | 2.01 | % | ||||||||||||||
| Return on average assets excluding intangible amortization (non-GAAP)(1) | 2.25 | % | 2.22 | % | 2.34 | % | 2.25 | % | 2.24 | % | 2.25 | % | 2.24 | % | ||||||||||||||
| Return on average assets, as adjusted, excluding intangible amortization (non-GAAP)(1) | 2.25 | % | 2.22 | % | 2.27 | % | 2.18 | % | 2.18 | % | 2.25 | % | 2.18 | % | ||||||||||||||
| Return on average common equity (ROE) | 11.09 | % | 11.04 | % | 11.91 | % | 11.77 | % | 11.75 | % | 11.09 | % | 11.75 | % | ||||||||||||||
| Return on average common equity, as adjusted: (ROE, as adjusted) (non-GAAP)(1) | 11.08 | % | 11.01 | % | 11.54 | % | 11.39 | % | 11.41 | % | 11.08 | % | 11.41 | % | ||||||||||||||
| Return on average tangible common equity (ROTCE) (non-GAAP)(1) | 16.56 | % | 16.65 | % | 18.28 | % | 18.26 | % | 18.39 | % | 16.56 | % | 18.39 | % | ||||||||||||||
| Return on average tangible common equity, as adjusted: (ROTCE, as adjusted) (non-GAAP)(1) | 16.55 | % | 16.60 | % | 17.70 | % | 17.68 | % | 17.87 | % | 16.55 | % | 17.87 | % | ||||||||||||||
| Return on average tangible common equity excluding intangible amortization (non-GAAP)(1) | 16.76 | % | 16.85 | % | 18.51 | % | 18.50 | % | 18.64 | % | 16.76 | % | 18.64 | % | ||||||||||||||
| Return on average tangible common equity, as adjusted, excluding intangible amortization (non-GAAP)(1) | 16.76 | % | 16.80 | % | 17.93 | % | 17.92 | % | 18.12 | % | 16.76 | % | 18.12 | % | ||||||||||||||
| (1) Calculation of this metric and the reconciliation to GAAP are included in the schedules accompanying this release. | ||||||||||||||||||||||||||||
| (2) Calculation of this metric is included in the schedules accompanying this release. | ||||||||||||||||||||||||||||
| Home BancShares, Inc. | ||||||||||||||||||||||||||||
| Selected Financial Information | ||||||||||||||||||||||||||||
| (Unaudited) | ||||||||||||||||||||||||||||
| Quarter Ended | Three Months Ended | |||||||||||||||||||||||||||
| (Dollars in thousands) | Mar. 31, 2026 | Dec. 31, 2025 | Sep. 30, 2025 | Jun. 30, 2025 | Mar. 31, 2025 | Mar. 31, 2026 | Mar. 31, 2025 | |||||||||||||||||||||
| Efficiency ratio | 41.59 | % | 39.54 | % | 40.21 | % | 41.68 | % | 42.22 | % | 41.59 | % | 42.22 | % | ||||||||||||||
| Efficiency ratio, as adjusted (non-GAAP)(1) | 41.99 | % | 39.53 | % | 40.95 | % | 42.01 | % | 42.84 | % | 41.99 | % | 42.84 | % | ||||||||||||||
| Net interest margin – FTE (NIM) | 4.51 | % | 4.61 | % | 4.56 | % | 4.44 | % | 4.44 | % | 4.51 | % | 4.44 | % | ||||||||||||||
| Fully taxable equivalent adjustment | $ | 2,661 | $ | 2,252 | $ | 2,916 | $ | 2,526 | $ | 2,534 | $ | 2,661 | $ | 2,534 | ||||||||||||||
| Total revenue (net) | 266,707 | 282,086 | 277,671 | 271,031 | 260,082 | 266,707 | 260,082 | |||||||||||||||||||||
| Pre-tax, pre-provision, net income (PPNR) (non-GAAP)(1) | 152,732 | 167,723 | 162,833 | 154,991 | 147,154 | 152,732 | 147,154 | |||||||||||||||||||||
| PPNR, as adjusted (non-GAAP)(1) | 152,677 | 167,130 | 157,704 | 150,404 | 142,821 | 152,677 | 142,821 | |||||||||||||||||||||
| Pre-tax net income to total revenue (net) | 57.08 | % | 54.35 | % | 57.38 | % | 56.08 | % | 56.58 | % | 57.08 | % | 56.58 | % | ||||||||||||||
| Pre-tax net income, as adjusted, to total revenue (net) (non-GAAP)(1) | 57.06 | % | 54.14 | % | 55.53 | % | 54.39 | % | 54.91 | % | 57.06 | % | 54.91 | % | ||||||||||||||
| P5NR(Pre-tax, pre-provision, profit percentage) (PPNR to total revenue (net)) (non-GAAP)(1) | 57.27 | % | 59.46 | % | 58.64 | % | 57.19 | % | 56.58 | % | 57.27 | % | 56.58 | % | ||||||||||||||
| P5NR, as adjusted (non-GAAP)(1) | 57.25 | % | 59.25 | % | 56.80 | % | 55.49 | % | 54.91 | % | 57.25 | % | 54.91 | % | ||||||||||||||
| Total purchase accounting accretion | $ | 1,061 | $ | 1,265 | $ | 1,272 | $ | 1,233 | $ | 1,378 | $ | 1,061 | $ | 1,378 | ||||||||||||||
| Average purchase accounting loan discounts | 12,507 | 13,753 | 15,009 | 16,219 | 17,493 | 12,507 | 17,493 | |||||||||||||||||||||
| OTHER OPERATING EXPENSES | ||||||||||||||||||||||||||||
| Advertising | $ | 2,227 | $ | 2,114 | $ | 2,149 | $ | 2,054 | $ | 1,928 | $ | 2,227 | $ | 1,928 | ||||||||||||||
| Amortization of intangibles | 1,938 | 1,938 | 2,024 | 2,025 | 2,047 | 1,938 | 2,047 | |||||||||||||||||||||
| Electronic banking expense | 3,326 | 3,288 | 3,357 | 3,172 | 3,055 | 3,326 | 3,055 | |||||||||||||||||||||
| Directors’ fees | 518 | 388 | 405 | 431 | 452 | 518 | 452 | |||||||||||||||||||||
| Due from bank service charges | 333 | 324 | 404 | 283 | 281 | 333 | 281 | |||||||||||||||||||||
| FDIC and state assessment | 1,599 | 2,970 | 3,245 | 1,636 | 3,387 | 1,599 | 3,387 | |||||||||||||||||||||
| Insurance | 1,074 | 1,044 | 1,110 | 1,049 | 999 | 1,074 | 999 | |||||||||||||||||||||
| Legal and accounting | 914 | 1,362 | 1,061 | 2,360 | 3,641 | 914 | 3,641 | |||||||||||||||||||||
| Other professional fees | 1,946 | 2,168 | 2,083 | 2,211 | 1,947 | 1,946 | 1,947 | |||||||||||||||||||||
| Operating supplies | 748 | 759 | 773 | 711 | 711 | 748 | 711 | |||||||||||||||||||||
| Postage | 543 | 564 | 538 | 488 | 503 | 543 | 503 | |||||||||||||||||||||
| Telephone | 363 | 382 | 367 | 419 | 436 | 363 | 436 | |||||||||||||||||||||
| Other expense | 11,065 | 10,504 | 9,819 | 12,496 | 8,703 | 11,065 | 8,703 | |||||||||||||||||||||
| Total other operating expenses | $ | 26,594 | $ | 27,805 | $ | 27,335 | $ | 29,335 | $ | 28,090 | $ | 26,594 | $ | 28,090 | ||||||||||||||
| (1) Calculation of this metric and the reconciliation to GAAP are included in the schedules accompanying this release. | ||||||||||||||||||||||||||||
| Home BancShares, Inc. | ||||||||||||||||||||
| Selected Financial Information | ||||||||||||||||||||
| (Unaudited) | ||||||||||||||||||||
| (Dollars in thousands) | Mar. 31, 2026 | Dec. 31, 2025 | Sep. 30, 2025 | Jun. 30, 2025 | Mar. 31, 2025 | |||||||||||||||
| BALANCE SHEET RATIOS | ||||||||||||||||||||
| Total loans to total deposits | 88.13 | % | 89.74 | % | 88.22 | % | 86.80 | % | 85.24 | % | ||||||||||
| Common equity to assets | 18.75 | % | 18.78 | % | 18.56 | % | 17.83 | % | 17.58 | % | ||||||||||
| Tangible common equity to tangible assets (non-GAAP)(1) | 13.42 | % | 13.36 | % | 13.08 | % | 12.35 | % | 12.09 | % | ||||||||||
| . | ||||||||||||||||||||
| LOANS RECEIVABLE | ||||||||||||||||||||
| Real estate | ||||||||||||||||||||
| Commercial real estate loans | ||||||||||||||||||||
| Non-farm/non-residential | $ | 5,395,529 | $ | 5,290,112 | $ | 5,494,492 | $ | 5,553,182 | $ | 5,588,681 | ||||||||||
| Construction/land development | 2,613,604 | 2,726,993 | 2,709,197 | 2,695,561 | 2,735,760 | |||||||||||||||
| Agricultural | 321,046 | 332,412 | 331,301 | 315,926 | 335,437 | |||||||||||||||
| Residential real estate loans | ||||||||||||||||||||
| Residential 1-4 family | 2,100,374 | 2,134,334 | 2,142,375 | 2,138,990 | 1,947,872 | |||||||||||||||
| Multifamily residential | 1,232,639 | 1,140,911 | 716,595 | 620,439 | 576,089 | |||||||||||||||
| Total real estate | 11,663,192 | 11,624,762 | 11,393,960 | 11,324,098 | 11,183,839 | |||||||||||||||
| Consumer | 1,254,936 | 1,253,746 | 1,233,523 | 1,218,834 | 1,227,745 | |||||||||||||||
| Commercial and industrial | 2,172,267 | 2,222,401 | 2,100,268 | 2,107,326 | 2,045,036 | |||||||||||||||
| Agricultural | 329,563 | 359,879 | 346,167 | 323,457 | 314,323 | |||||||||||||||
| Other | 213,670 | 225,421 | 212,054 | 206,909 | 181,173 | |||||||||||||||
| Loans receivable | $ | 15,633,628 | $ | 15,686,209 | $ | 15,285,972 | $ | 15,180,624 | $ | 14,952,116 | ||||||||||
| ALLOWANCE FOR CREDIT LOSSES | ||||||||||||||||||||
| Balance, beginning of period | $ | 297,583 | $ | 285,649 | $ | 281,869 | $ | 279,944 | $ | 275,880 | ||||||||||
| Loans charged off | 2,849 | 3,063 | 4,651 | 4,071 | 3,458 | |||||||||||||||
| Recoveries of loans previously charged off | 1,400 | 597 | 1,731 | 2,996 | 7,522 | |||||||||||||||
| Net loans charged off (recovered) | 1,449 | 2,466 | 2,920 | 1,075 | (4,064 | ) | ||||||||||||||
| Provision for credit losses – loans | 1,500 | 14,400 | 6,700 | 3,000 | — | |||||||||||||||
| Balance, end of period | $ | 297,634 | $ | 297,583 | $ | 285,649 | $ | 281,869 | $ | 279,944 | ||||||||||
| Net charge-offs (recoveries) to average total loans | 0.04 | % | 0.06 | % | 0.08 | % | 0.03 | % | (0.11 | )% | ||||||||||
| Allowance for credit losses to total loans | 1.90 | % | 1.90 | % | 1.87 | % | 1.86 | % | 1.87 | % | ||||||||||
| NON-PERFORMING ASSETS | ||||||||||||||||||||
| Non-performing loans | ||||||||||||||||||||
| Non-accrual loans | $ | 179,639 | $ | 78,002 | $ | 81,087 | $ | 89,261 | $ | 86,383 | ||||||||||
| Loans past due 90 days or more | 2,481 | 6,980 | 4,125 | 7,031 | 3,264 | |||||||||||||||
| Total non-performing loans | 182,120 | 84,982 | 85,212 | 96,292 | 89,647 | |||||||||||||||
| Other non-performing assets | ||||||||||||||||||||
| Foreclosed assets held for sale, net | 40,874 | 39,831 | 41,263 | 41,529 | 39,680 | |||||||||||||||
| Other non-performing assets | 1,140 | — | — | — | 63 | |||||||||||||||
| Total other non-performing assets | 42,014 | 39,831 | 41,263 | 41,529 | 39,743 | |||||||||||||||
| Total non-performing assets | $ | 224,134 | $ | 124,813 | $ | 126,475 | $ | 137,821 | $ | 129,390 | ||||||||||
| Allowance for credit losses for loans to non-performing loans | 163.43 | % | 350.17 | % | 335.22 | % | 292.72 | % | 312.27 | % | ||||||||||
| Non-performing loans to total loans | 1.16 | % | 0.54 | % | 0.56 | % | 0.63 | % | 0.60 | % | ||||||||||
| Non-performing assets to total assets | 0.97 | % | 0.55 | % | 0.56 | % | 0.60 | % | 0.56 | % | ||||||||||
| (1) Calculation of this metric and the reconciliation to GAAP are included in the schedules accompanying this release. | ||||||||||||||||||||
| Home BancShares, Inc. | ||||||||||||||||||
| Consolidated Net Interest Margin | ||||||||||||||||||
| (Unaudited) | ||||||||||||||||||
| Three Months Ended | ||||||||||||||||||
| March 31, 2026 | December 31, 2025 | |||||||||||||||||
| (Dollars in thousands) | Average Balance | Income/ Expense | Yield/ Rate | Average Balance | Income/ Expense | Yield/ Rate | ||||||||||||
| ASSETS | ||||||||||||||||||
| Earning assets | ||||||||||||||||||
| Interest-bearing balances due from banks | $ | 557,451 | $ | 4,945 | 3.60 | % | $ | 450,187 | $ | 4,405 | 3.88 | % | ||||||
| Federal funds sold | 5,282 | 48 | 3.69 | % | 4,177 | 41 | 3.89 | % | ||||||||||
| Investment securities – taxable | 2,935,901 | 24,728 | 3.42 | % | 3,001,146 | 25,860 | 3.42 | % | ||||||||||
| Investment securities – non-taxable – FTE | 1,175,663 | 10,285 | 3.55 | % | 1,166,233 | 10,240 | 3.48 | % | ||||||||||
| Loans receivable – FTE | 15,680,598 | 273,678 | 7.08 | % | 15,506,534 | 285,337 | 7.30 | % | ||||||||||
| Total interest-earning assets | 20,354,895 | 313,684 | 6.25 | % | 20,128,277 | 325,883 | 6.42 | % | ||||||||||
| Non-earning assets | 2,599,546 | 2,658,575 | ||||||||||||||||
| Total assets | $ | 22,954,441 | $ | 22,786,852 | ||||||||||||||
| LIABILITIES AND SHAREHOLDERS’ EQUITY | ||||||||||||||||||
| Liabilities | ||||||||||||||||||
| Interest-bearing liabilities | ||||||||||||||||||
| Savings and interest-bearing transaction accounts | $ | 11,868,976 | $ | 64,408 | 2.20 | % | $ | 11,613,721 | $ | 67,534 | 2.31 | % | ||||||
| Time deposits | 1,795,501 | 14,737 | 3.33 | % | 1,858,205 | 16,205 | 3.46 | % | ||||||||||
| Total interest-bearing deposits | 13,664,477 | 79,145 | 2.35 | % | 13,471,926 | 83,739 | 2.47 | % | ||||||||||
| Securities sold under agreement to repurchase | 151,877 | 927 | 2.48 | % | 148,791 | 962 | 2.57 | % | ||||||||||
| FHLB and other borrowed funds | 500,250 | 4,692 | 3.80 | % | 518,188 | 4,985 | 3.82 | % | ||||||||||
| Subordinated debentures | 279,350 | 2,355 | 3.42 | % | 279,180 | 2,359 | 3.35 | % | ||||||||||
| Total interest-bearing liabilities | 14,595,954 | 87,119 | 2.42 | % | 14,418,085 | 92,045 | 2.53 | % | ||||||||||
| Non-interest bearing liabilities | ||||||||||||||||||
| Non-interest bearing deposits | 3,856,492 | 3,926,307 | ||||||||||||||||
| Other liabilities | 177,275 | 193,604 | ||||||||||||||||
| Total liabilities | 18,629,721 | 18,537,996 | ||||||||||||||||
| Shareholders’ equity | 4,324,720 | 4,248,856 | ||||||||||||||||
| Total liabilities and shareholders’ equity | $ | 22,954,441 | $ | 22,786,852 | ||||||||||||||
| Net interest spread | 3.83 | % | 3.89 | % | ||||||||||||||
| Net interest income and margin – FTE | $ | 226,565 | 4.51 | % | $ | 233,838 | 4.61 | % | ||||||||||
| Home BancShares, Inc. | ||||||||||||||||||
| Consolidated Net Interest Margin | ||||||||||||||||||
| (Unaudited) | ||||||||||||||||||
| Three Months Ended | ||||||||||||||||||
| March 31, 2026 | March 31, 2025 | |||||||||||||||||
| (Dollars in thousands) | Average Balance | Income/ Expense | Yield/ Rate | Average Balance | Income/ Expense | Yield/ Rate | ||||||||||||
| ASSETS | ||||||||||||||||||
| Earning assets | ||||||||||||||||||
| Interest-bearing balances due from banks | $ | 557,451 | $ | 4,945 | 3.60 | % | $ | 611,962 | $ | 6,620 | 4.39 | % | ||||||
| Federal funds sold | 5,282 | 48 | 3.69 | % | 5,091 | 55 | 4.38 | % | ||||||||||
| Investment securities – taxable | 2,935,901 | 24,728 | 3.42 | % | 3,179,290 | 27,433 | 3.50 | % | ||||||||||
| Investment securities – non-taxable – FTE | 1,175,663 | 10,285 | 3.55 | % | 1,135,783 | 10,061 | 3.59 | % | ||||||||||
| Loans receivable – FTE | 15,680,598 | 273,678 | 7.08 | % | 14,893,912 | 270,907 | 7.38 | % | ||||||||||
| Total interest-earning assets | 20,354,895 | 313,684 | 6.25 | % | 19,826,038 | 315,076 | 6.45 | % | ||||||||||
| Non-earning assets | 2,599,546 | 2,722,797 | ||||||||||||||||
| Total assets | $ | 22,954,441 | $ | 22,548,835 | ||||||||||||||
| LIABILITIES AND SHAREHOLDERS’ EQUITY | ||||||||||||||||||
| Liabilities | ||||||||||||||||||
| Interest-bearing liabilities | ||||||||||||||||||
| Savings and interest-bearing transaction accounts | $ | 11,868,976 | $ | 64,408 | 2.20 | % | $ | 11,402,688 | $ | 69,672 | 2.48 | % | ||||||
| Time deposits | 1,795,501 | 14,737 | 3.33 | % | 1,801,503 | 17,114 | 3.85 | % | ||||||||||
| Total interest-bearing deposits | 13,664,477 | 79,145 | 2.35 | % | 13,204,191 | 86,786 | 2.67 | % | ||||||||||
| Securities sold under agreement to repurchase | 151,877 | 927 | 2.48 | % | 155,861 | 1,074 | 2.79 | % | ||||||||||
| FHLB and other borrowed funds | 500,250 | 4,692 | 3.80 | % | 600,681 | 5,902 | 3.98 | % | ||||||||||
| Subordinated debentures | 279,350 | 2,355 | 3.42 | % | 439,173 | 4,124 | 3.81 | % | ||||||||||
| Total interest-bearing liabilities | 14,595,954 | 87,119 | 2.42 | % | 14,399,906 | 97,886 | 2.76 | % | ||||||||||
| Non-interest bearing liabilities | ||||||||||||||||||
| Non-interest bearing deposits | 3,856,492 | 3,980,944 | ||||||||||||||||
| Other liabilities | 177,275 | 190,314 | ||||||||||||||||
| Total liabilities | 18,629,721 | 18,571,164 | ||||||||||||||||
| Shareholders’ equity | 4,324,720 | 3,977,671 | ||||||||||||||||
| Total liabilities and shareholders’ equity | $ | 22,954,441 | $ | 22,548,835 | ||||||||||||||
| Net interest spread | 3.83 | % | 3.69 | % | ||||||||||||||
| Net interest income and margin – FTE | $ | 226,565 | 4.51 | % | $ | 217,190 | 4.44 | % | ||||||||||
| Home BancShares, Inc. | ||||||||||||||||||||||||||||
| Non-GAAP Reconciliations | ||||||||||||||||||||||||||||
| (Unaudited) | ||||||||||||||||||||||||||||
| Quarter Ended | Three Months Ended | |||||||||||||||||||||||||||
| (Dollars and shares in thousands, except per share data) | Mar. 31, 2026 | Dec. 31, 2025 | Sep. 30, 2025 | Jun. 30, 2025 | Mar. 31, 2025 | Mar. 31, 2026 | Mar. 31, 2025 | |||||||||||||||||||||
| NET INCOME (EARNINGS), AS ADJUSTED | ||||||||||||||||||||||||||||
| GAAP net income available to common shareholders (A) | $ | 118,209 | $ | 118,225 | $ | 123,604 | $ | 118,403 | $ | 115,209 | $ | 118,209 | $ | 115,209 | ||||||||||||||
| Pre-tax adjustments | ||||||||||||||||||||||||||||
| Merger and acquisition expense | 394 | 580 | — | — | — | 394 | — | |||||||||||||||||||||
| Gain on retirement of subordinated debt | — | — | (1,882 | ) | — | — | — | — | ||||||||||||||||||||
| FDIC special assessment credit | (1,697 | ) | — | — | (1,516 | ) | — | (1,697 | ) | — | ||||||||||||||||||
| BOLI death benefits | — | — | (187 | ) | (1,243 | ) | — | — | — | |||||||||||||||||||
| Gain on sale of premises and equipment | — | — | — | (983 | ) | — | — | — | ||||||||||||||||||||
| Fair value adjustment for marketable securities | 1,248 | (1,173 | ) | (1,020 | ) | 238 | (442 | ) | 1,248 | (442 | ) | |||||||||||||||||
| Special income from equity investment | — | — | — | (3,498 | ) | (3,891 | ) | — | (3,891 | ) | ||||||||||||||||||
| Legal fee reimbursement | — | — | — | (885 | ) | — | — | — | ||||||||||||||||||||
| Legal claims expense | — | — | — | 3,300 | — | — | — | |||||||||||||||||||||
| Recoveries on historic losses | — | — | (2,040 | ) | — | — | — | — | ||||||||||||||||||||
| Total pre-tax adjustments | (55 | ) | (593 | ) | (5,129 | ) | (4,587 | ) | (4,333 | ) | (55 | ) | (4,333 | ) | ||||||||||||||
| Tax-effect of adjustments | (13 | ) | (231 | ) | (1,207 | ) | (817 | ) | (1,059 | ) | (13 | ) | (1,059 | ) | ||||||||||||||
| Total adjustments after-tax (B) | (42 | ) | (362 | ) | (3,922 | ) | (3,770 | ) | (3,274 | ) | (42 | ) | (3,274 | ) | ||||||||||||||
| Net income, as adjusted (C) | $ | 118,167 | $ | 117,863 | $ | 119,682 | $ | 114,633 | $ | 111,935 | $ | 118,167 | $ | 111,935 | ||||||||||||||
| Average diluted shares outstanding (D) | 196,733 | 196,764 | 197,288 | 197,765 | 198,852 | 196,733 | 198,852 | |||||||||||||||||||||
| GAAP diluted earnings per share: (A/D) | $ | 0.60 | $ | 0.60 | $ | 0.63 | $ | 0.60 | $ | 0.58 | $ | 0.60 | $ | 0.58 | ||||||||||||||
| Adjustments after-tax: (B/D) | 0.00 | 0.00 | (0.02 | ) | (0.02 | ) | (0.02 | ) | 0.00 | (0.02 | ) | |||||||||||||||||
| Diluted earnings per common share, as adjusted: (C/D) | $ | 0.60 | $ | 0.60 | $ | 0.61 | $ | 0.58 | $ | 0.56 | $ | 0.60 | $ | 0.56 | ||||||||||||||
| ANNUALIZED RETURN ON AVERAGE ASSETS | ||||||||||||||||||||||||||||
| Return on average assets: (A/E) | 2.09 | % | 2.06 | % | 2.17 | % | 2.08 | % | 2.07 | % | 2.09 | % | 2.07 | % | ||||||||||||||
| Return on average assets, as adjusted: (ROA, as adjusted) ((A+D)/E) | 2.09 | % | 2.05 | % | 2.10 | % | 2.02 | % | 2.01 | % | 2.09 | % | 2.01 | % | ||||||||||||||
| Return on average assets excluding intangible amortization: ((A+C)/(E-F)) | 2.25 | % | 2.22 | % | 2.34 | % | 2.25 | % | 2.24 | % | 2.25 | % | 2.24 | % | ||||||||||||||
| Return on average assets, as adjusted, excluding intangible amortization: ((A+C+D)/(E-F)) | 2.25 | % | 2.22 | % | 2.27 | % | 2.18 | % | 2.18 | % | 2.25 | % | 2.18 | % | ||||||||||||||
| GAAP net income available to common shareholders (A) | $ | 118,209 | $ | 118,225 | $ | 123,604 | $ | 118,403 | $ | 115,209 | $ | 118,209 | $ | 115,209 | ||||||||||||||
| Amortization of intangibles (B) | 1,938 | 1,938 | 2,024 | 2,025 | 2,047 | 1,938 | 2,047 | |||||||||||||||||||||
| Amortization of intangibles after-tax (C) | 1,466 | 1,466 | 1,529 | 1,530 | 1,547 | 1,466 | 1,547 | |||||||||||||||||||||
| Adjustments after-tax (D) | (42 | ) | (362 | ) | (3,922 | ) | (3,770 | ) | (3,274 | ) | (42 | ) | (3,274 | ) | ||||||||||||||
| Average assets (E) | 22,954,441 | 22,786,852 | 22,638,938 | 22,797,738 | 22,548,835 | 22,954,441 | 22,548,835 | |||||||||||||||||||||
| Average goodwill & core deposit intangible (F) | 1,429,527 | 1,431,479 | 1,433,474 | 1,435,480 | 1,437,515 | 1,429,527 | 1,437,515 | |||||||||||||||||||||
| Home BancShares, Inc. | ||||||||||||||||||||||||||||
| Non-GAAP Reconciliations | ||||||||||||||||||||||||||||
| (Unaudited) | ||||||||||||||||||||||||||||
| Quarter Ended | Three Months Ended | |||||||||||||||||||||||||||
| (Dollars in thousands) | Mar. 31, 2026 | Dec. 31, 2025 | Sep. 30, 2025 | Jun. 30, 2025 | Mar. 31, 2025 | Mar. 31, 2026 | Mar. 31, 2025 | |||||||||||||||||||||
| ANNUALIZED RETURN ON AVERAGE COMMON EQUITY | ||||||||||||||||||||||||||||
| Return on average common equity: (A/D) | 11.09 | % | 11.04 | % | 11.91 | % | 11.77 | % | 11.75 | % | 11.09 | % | 11.75 | % | ||||||||||||||
| Return on average common equity, as adjusted: (ROE, as adjusted) ((A+C)/D) | 11.08 | % | 11.01 | % | 11.54 | % | 11.39 | % | 11.41 | % | 11.08 | % | 11.41 | % | ||||||||||||||
| Return on average tangible common equity: (ROTCE) (A/(D-E)) | 16.56 | % | 16.65 | % | 18.28 | % | 18.26 | % | 18.39 | % | 16.56 | % | 18.39 | % | ||||||||||||||
| Return on average tangible common equity, as adjusted: (ROTCE, as adjusted) ((A+C)/(D-E)) | 16.55 | % | 16.60 | % | 17.70 | % | 17.68 | % | 17.87 | % | 16.55 | % | 17.87 | % | ||||||||||||||
| Return on average tangible common equity excluding intangible amortization: (B/(D-E)) | 16.76 | % | 16.85 | % | 18.51 | % | 18.50 | % | 18.64 | % | 16.76 | % | 18.64 | % | ||||||||||||||
| Return on average tangible common equity, as adjusted, excluding intangible amortization: ((B+C)/(D-E)) | 16.76 | % | 16.80 | % | 17.93 | % | 17.92 | % | 18.12 | % | 16.76 | % | 18.12 | % | ||||||||||||||
| GAAP net income available to common shareholders (A) | $ | 118,209 | $ | 118,225 | $ | 123,604 | $ | 118,403 | $ | 115,209 | $ | 118,209 | $ | 115,209 | ||||||||||||||
| Earnings excluding intangible amortization (B) | 119,675 | 119,691 | 125,133 | 119,933 | 116,756 | 119,675 | 116,756 | |||||||||||||||||||||
| Adjustments after-tax (C) | (42 | ) | (362 | ) | (3,922 | ) | (3,770 | ) | (3,274 | ) | (42 | ) | (3,274 | ) | ||||||||||||||
| Average common equity (D) | 4,324,720 | 4,248,856 | 4,115,884 | 4,036,155 | 3,977,671 | 4,324,720 | 3,977,671 | |||||||||||||||||||||
| Average goodwill & core deposits intangible (E) | 1,429,527 | 1,431,479 | 1,433,474 | 1,435,480 | 1,437,515 | 1,429,527 | 1,437,515 | |||||||||||||||||||||
| EFFICIENCY RATIO & P5NR | ||||||||||||||||||||||||||||
| Efficiency ratio: ((D-G)/(B+C+E)) | 41.59 | % | 39.54 | % | 40.21 | % | 41.68 | % | 42.22 | % | 41.59 | % | 42.22 | % | ||||||||||||||
| Efficiency ratio, as adjusted: ((D-G-I)/(B+C+E-H)) | 41.99 | % | 39.53 | % | 40.95 | % | 42.01 | % | 42.84 | % | 41.99 | % | 42.84 | % | ||||||||||||||
| Pre-tax net income to total revenue (net) (A/(B+C)) | 57.08 | % | 54.35 | % | 57.38 | % | 56.08 | % | 56.58 | % | 57.08 | % | 56.58 | % | ||||||||||||||
| Pre-tax net income, as adjusted, to total revenue (net) ((A+F)/(B+C)) | 57.06 | % | 54.14 | % | 55.53 | % | 54.39 | % | 54.91 | % | 57.06 | % | 54.91 | % | ||||||||||||||
| Pre-tax, pre-provision, net income (PPNR) (B+C-D) | $ | 152,732 | $ | 167,723 | $ | 162,833 | $ | 154,991 | $ | 147,154 | $ | 152,732 | $ | 147,154 | ||||||||||||||
| Pre-tax, pre-provision, net income, as adjusted (B+C-D+F) | $ | 152,677 | $ | 167,130 | $ | 157,704 | $ | 150,404 | $ | 142,821 | $ | 152,677 | $ | 142,821 | ||||||||||||||
| P5NR (Pre-tax, pre-provision, profit percentage) PPNR to total revenue (net)) (B+C-D)/(B+C) | 57.27 | % | 59.46 | % | 58.64 | % | 57.19 | % | 56.58 | % | 57.27 | % | 56.58 | % | ||||||||||||||
| P5NR, as adjusted (B+C-D+F)/(B+C) | 57.25 | % | 59.25 | % | 56.80 | % | 55.49 | % | 54.91 | % | 57.25 | % | 54.91 | % | ||||||||||||||
| Pre-tax net income (A) | $ | 152,232 | $ | 153,323 | $ | 159,327 | $ | 151,991 | $ | 147,154 | $ | 152,232 | $ | 147,154 | ||||||||||||||
| Net interest income (B) | 223,904 | 231,586 | 226,166 | 219,952 | 214,656 | 223,904 | 214,656 | |||||||||||||||||||||
| Non-interest income (C) | 42,803 | 50,500 | 51,505 | 51,079 | 45,426 | 42,803 | 45,426 | |||||||||||||||||||||
| Non-interest expense (D) | 113,975 | 114,363 | 114,838 | 116,040 | 112,928 | 113,975 | 112,928 | |||||||||||||||||||||
| Fully taxable equivalent adjustment (E) | 2,661 | 2,252 | 2,916 | 2,526 | 2,534 | 2,661 | 2,534 | |||||||||||||||||||||
| Total pre-tax adjustments (F) | (55 | ) | (593 | ) | (5,129 | ) | (4,587 | ) | (4,333 | ) | (55 | ) | (4,333 | ) | ||||||||||||||
| Amortization of intangibles (G) | 1,938 | 1,938 | 2,024 | 2,025 | 2,047 | 1,938 | 2,047 | |||||||||||||||||||||
| Adjustments: | ||||||||||||||||||||||||||||
| Non-interest income: | ||||||||||||||||||||||||||||
| Gain on retirement of subordinated debt | $ | — | $ | — | $ | 1,882 | $ | — | $ | — | $ | — | $ | — | ||||||||||||||
| Fair value adjustment for marketable securities | (1,248 | ) | 1,173 | 1,020 | (238 | ) | 442 | (1,248 | ) | 442 | ||||||||||||||||||
| Gain (loss) on OREO | 707 | 203 | (1 | ) | 13 | (376 | ) | 707 | (376 | ) | ||||||||||||||||||
| Gain (loss) on branches, equipment and other assets, net | (7 | ) | 11 | (66 | ) | 972 | (163 | ) | (7 | ) | (163 | ) | ||||||||||||||||
| Special income from equity investment | — | — | — | 3,498 | 3,891 | — | 3,891 | |||||||||||||||||||||
| BOLI death benefits | — | — | 187 | 1,243 | — | — | — | |||||||||||||||||||||
| Legal expense reimbursement | — | — | — | 885 | — | — | — | |||||||||||||||||||||
| Recoveries on historic losses | — | — | 2,040 | — | — | — | — | |||||||||||||||||||||
| Total non-interest income adjustments (H) | $ | (548 | ) | $ | 1,387 | $ | 5,062 | $ | 6,373 | $ | 3,794 | $ | (548 | ) | $ | 3,794 | ||||||||||||
| Non-interest expense: | ||||||||||||||||||||||||||||
| FDIC special assessment credit | (1,697 | ) | — | — | (1,516 | ) | — | (1,697 | ) | — | ||||||||||||||||||
| Merger and acquisition expenses | 394 | 580 | — | — | — | 394 | — | |||||||||||||||||||||
| Legal claims expense | — | — | — | 3,300 | — | — | — | |||||||||||||||||||||
| Legal expense reimbursement | — | — | — | — | — | — | — | |||||||||||||||||||||
| TRUPS redemption fees | — | — | — | — | — | — | — | |||||||||||||||||||||
| Total non-interest expense adjustments (I) | $ | (1,303 | ) | $ | 580 | $ | — | $ | 1,784 | $ | — | $ | (1,303 | ) | $ | — | ||||||||||||
| Home BancShares, Inc. | ||||||||||||||||||||
| Non-GAAP Reconciliations | ||||||||||||||||||||
| (Unaudited) | ||||||||||||||||||||
| Quarter Ended | ||||||||||||||||||||
| Mar. 31, 2026 | Dec. 31, 2025 | Sep. 30, 2025 | Jun. 30, 2025 | Mar. 31, 2025 | ||||||||||||||||
| TANGIBLE BOOK VALUE PER COMMON SHARE | ||||||||||||||||||||
| Book value per common share: (A/B) | $ | 22.15 | $ | 21.88 | $ | 21.41 | $ | 20.71 | $ | 20.40 | ||||||||||
| Tangible book value per common share: ((A-C-D)/B) | 14.87 | 14.60 | 14.13 | 13.44 | 13.15 | |||||||||||||||
| Total shareholders’ equity (A) | $ | 4,349,585 | $ | 4,296,871 | $ | 4,214,964 | $ | 4,085,316 | $ | 4,042,555 | ||||||||||
| End of period common shares outstanding (B) | 196,394 | 196,357 | 196,889 | 197,239 | 198,206 | |||||||||||||||
| Goodwill (C) | 1,398,253 | 1,398,253 | 1,398,253 | 1,398,253 | 1,398,253 | |||||||||||||||
| Core deposit and other intangibles (D) | 30,355 | 32,293 | 34,231 | 36,255 | 38,280 | |||||||||||||||
| TANGIBLE COMMON EQUITY TO TANGIBLE ASSETS | ||||||||||||||||||||
| Equity to assets: (B/A) | 18.75 | % | 18.78 | % | 18.56 | % | 17.83 | % | 17.58 | % | ||||||||||
| Tangible common equity to tangible assets: ((B-C-D)/(A-C-D)) | 13.42 | % | 13.36 | % | 13.08 | % | 12.35 | % | 12.09 | % | ||||||||||
| Total assets (A) | $ | 23,201,679 | $ | 22,881,879 | $ | 22,707,802 | $ | 22,907,022 | $ | 22,992,203 | ||||||||||
| Total shareholders’ equity (B) | 4,349,585 | 4,296,871 | 4,214,964 | 4,085,316 | 4,042,555 | |||||||||||||||
| Goodwill (C) | 1,398,253 | 1,398,253 | 1,398,253 | 1,398,253 | 1,398,253 | |||||||||||||||
| Core deposit and other intangibles (D) | 30,355 | 32,293 | 34,231 | 36,255 | 38,280 | |||||||||||||||
| Home BancShares, Inc. | ||||||||||||||||||||||||||||
| Shareholder Buyback Yield | ||||||||||||||||||||||||||||
| (Unaudited) | ||||||||||||||||||||||||||||
| Quarter Ended | Three Months Ended | |||||||||||||||||||||||||||
| (Dollars and shares in thousands) | Mar. 31, 2026 | Dec. 31, 2025 | Sep. 30, 2025 | Jun. 30, 2025 | Mar. 31, 2025 | Mar. 31, 2026 | Mar. 31, 2025 | |||||||||||||||||||||
| SHAREHOLDER BUYBACK YIELD | ||||||||||||||||||||||||||||
| Shareholder buyback yield: (A/B) | 0.25 | % | 0.27 | % | 0.18 | % | 0.49 | % | 0.53 | % | 0.25 | % | 0.53 | % | ||||||||||||||
| Shares repurchased | 508 | 541 | 350 | 1,000 | 1,000 | 508 | 1,000 | |||||||||||||||||||||
| Average price per share | $ | 27.32 | $ | 27.26 | $ | 28.34 | $ | 26.99 | $ | 29.67 | $ | 27.32 | $ | 29.67 | ||||||||||||||
| Principal cost | 13,877 | 14,747 | 9,918 | 26,989 | 29,668 | 13,877 | 29,668 | |||||||||||||||||||||
| Excise tax | 1 | 141 | 93 | 459 | 117 | 1 | 117 | |||||||||||||||||||||
| Total share repurchase cost (A) | $ | 13,878 | $ | 14,888 | $ | 10,011 | $ | 27,448 | $ | 29,785 | $ | 13,878 | $ | 29,785 | ||||||||||||||
| Shares outstanding beginning of period | 196,357 | 196,889 | 197,239 | 198,206 | 198,882 | 196,357 | 198,882 | |||||||||||||||||||||
| Price per share beginning of period | $ | 27.78 | $ | 28.30 | $ | 28.46 | $ | 28.27 | $ | 28.30 | $ | 27.78 | $ | 28.30 | ||||||||||||||
| Market capitalization beginning of period (B) | $ | 5,454,797 | $ | 5,571,959 | $ | 5,613,422 | $ | 5,603,284 | $ | 5,628,361 | $ | 5,454,797 | $ | 5,628,361 | ||||||||||||||
Photos accompanying this announcement are available at:
https://www.globenewswire.com/NewsRoom/AttachmentNg/14849342-ab1e-40ba-b160-86e77a134bb4
https://www.globenewswire.com/NewsRoom/AttachmentNg/ba84c01c-3e72-4007-a106-1b95878c1a31
https://www.globenewswire.com/NewsRoom/AttachmentNg/faadfc48-0196-4a04-996d-3001bb1c1a9e
https://www.globenewswire.com/NewsRoom/AttachmentNg/e530a445-31a0-4d49-ab54-066c479360ba
https://www.globenewswire.com/NewsRoom/AttachmentNg/6d11e04c-5b69-4246-8162-d5cb07da27ac
https://www.globenewswire.com/NewsRoom/AttachmentNg/cd40c9ae-2764-495a-ae78-95748149c840
https://www.globenewswire.com/NewsRoom/AttachmentNg/9137099a-3f33-4e82-8e83-e200c1b1cd00
https://www.globenewswire.com/NewsRoom/AttachmentNg/9371b799-af76-4084-9f6b-858772be8b10
https://www.globenewswire.com/NewsRoom/AttachmentNg/0a87ed3b-2275-4fb3-8cb2-45164f79579b
https://www.globenewswire.com/NewsRoom/AttachmentNg/1bfe29ac-3c06-43cb-aa19-d4874f8ab22d
https://www.globenewswire.com/NewsRoom/AttachmentNg/434a3466-ed8c-41be-a5f0-75f0ef48d7f7
![]()
