Gen Z Drives Canada’s Credit Growth as Delinquencies Begin to Stabilize
Key findings from TransUnion report:
- Credit delinquencies showed signs of stabilizing during a period of relative economic stability
- Mortgage balances continued to climb, while delinquency rates returned to pre-pandemic levels
- Regional delinquency trends highlight diverging risk profiles across the provinces
TORONTO, June 23, 2026 (GLOBE NEWSWIRE) — Gen Z is emerging as the fastest growing and most dynamic segment in the Canadian credit market, according to TransUnion analysis released alongside the Q1 2026 Credit Industry Insights Report (CIIR). As more Gen Z consumers enter the financial ecosystem and become credit eligible, growth in credit demand and supply, coupled with year-over-year (YoY) improvements in credit performance, has supported this trend.
The number of credit active Gen Z consumers increased by more than 460,000 new participants YoY, a 7.8% rise – the fastest growth across all generations. At the same time, Gen Z borrowers also took on more non-mortgage debt, with average balances up more than 9% YoY, outpacing other generations. This suggests a shift beyond early credit adoption toward higher credit utilization, as more Gen Z consumers expand their wallet profiles with additional credit products.
Recent borrowing patterns among Gen Z consumers reflect demand for products offering accessible funding, streamlined approval processes and flexible repayment options, which suggest increased use of credit for day-to-day expenses rather than longer-term borrowing. While this group generally holds a higher share of credit card and personal loan debt, older Gen Z consumers are beginning to participate in secured loans, such as auto loans and mortgages. Although Gen Z currently carries lower overall debt on average than other generations, their balances may continue to grow as more consumers enter the market and existing borrowers move through additional life stages.
| Non-Mortgage Balance Per Consumer by Generation | |||
| Q1 2025 Avg. non-mortgage balance per consumer | Q1 2026 Avg. non-mortgage balance per consumer | YoY Change (%) | |
| Gen Z | $12,483 | $13,621 | 9.1% |
| Millennials | $28,048 | $29,747 | 6.1% |
| Gen X | $41,234 | $42,226 | 2.4% |
| Baby Boomers | $25,177 | $25,128 | -0.2% |
| Silent Generation | $10,318 | $10,252 | -0.6% |
| Source: TransUnion Canada Credit Database | |||
Gen Z consumers are significantly less likely to be scored in above prime risk tiers than the overall population, which is largely due to their shorter credit histories and thinner credit files on average. Currently, 19.9% of Gen Z consumers are considered super prime, compared to 42.2% of the total population. However, many Gen Z consumers are still early in their credit journeys and have potential for future score improvements and broader access to credit products over time access to the right products and data, as demonstrated by prior TransUnion studies.
Despite higher balances and participation, credit performance among Gen Z consumers improved across all levels of delinquency over the past year, showing that fewer Gen Z consumers have fallen behind on payments. However, Gen Z still had the highest incidence of delinquency compared to other generations, reflecting their earlier stage in the credit lifecycle and lower credit scores.
| Serious Delinquency Rates by Generation | |||
| Q1 2025 Serious Delinquency (Consumer-level 90_ DPD) | Q1 2026 Serious Delinquency (Consumer-level 90_ DPD) | YoY Change (bps) | |
| Gen Z | 2.86% | 2.75% | -11 |
| Millennials | 2.41% | 2.39% | -2 |
| Gen X | 1.76% | 1.74% | -2 |
| Baby Boomers | 0.93% | 0.91% | -2 |
| Silent Generation | 0.86% | 0.83% | -3 |
| Source: TransUnion Canada Credit Database | |||
Overall growth among older generations may moderate over the next three to five years as consumers continue to pay down existing debt and slow their rate of new borrowing. As a result, younger borrowers may represent an increasingly important segment of future credit growth, while remaining relatively early in their credit journeys.
“The Canadian credit market is transitioning to a phase of stabilizing risk, with signs of normalization. While Gen Z continues to exhibit higher delinquency rates than other generations, they have shown the strongest year-over-year improvement in credit performance, signaling improving credit performance trends,” said Matt Fabian, senior director of financial services research and consulting at TransUnion Canada. “These trends may create opportunities for lenders to balance risk management and growth objectives, particularly in high-demand segments like Gen Z.”
Canadian Consumer Credit Delinquencies Show Signs of Stabilization
Canadian consumers are showing signs that credit stress may be stabilizing, with serious delinquency rates across major lending products remaining above pre-2023 levels but rising more slowly or remaining flat in recent quarters. Total consumer delinquency (90+ days past due) rose from 1.48% in early 2022 to 1.86% in Q1 2026, with most products peaking in early 2025 before stabilizing.
Delinquencies across most product categories showed slight YoY increases in Q1 2026, but the pace of change slowed, signaling potential stabilization. Credit cards and lines of credit began to level off, while personal loans showed continued strain in repayment performance. Auto lending also showed higher delinquencies, likely driven by higher vehicle costs, financing rates and other market conditions, with fraud potentially contributing to elevated delinquency levels. Mortgage delinquencies, while low compared to historic levels, have gradually increased over the past two years, indicating continued pressure in secured lending.
| Consumer Level Serious Delinquency by Product | ||||||||||
| Cards 90 DPD | Auto 60DPD | LOC 60DPD | Install 60DPD | Mortgage 60DPD | ||||||
| Q1 2024 | 0.91 | % | 0.91 | % | 0.40 | % | 2.06 | % | 0.23 | % |
| Q1 2025 | 0.99 | % | 0.92 | % | 0.47 | % | 2.52 | % | 0.26 | % |
| Q1 2026 | 0.98 | % | 0.96 | % | 0.45 | % | 2.60 | % | 0.29 | % |
| YoY | -1 | 4 | -2 | 8 | 3 | |||||
| Source: TransUnion Canada Credit Database | ||||||||||
At the national level, serious consumer delinquency rates are showing signs of stabilization, although underlying performance continues to vary significantly across provinces. As of Q1 2026, total consumer delinquency (90+ days past due) across all credit products edged slightly lower YoY to 1.86%, which suggests that, while elevated, overall credit stress may be leveling off.
Regional differences have become more pronounced, highlighting differing economic conditions across the country. Alberta remains an outlier, with delinquency rising to 2.43%, up 6 basis points YoY, consistent with regions tied to industries that are historically more volatile and sensitive to economic conditions.
In contrast, several provinces have seen meaningful improvement. Manitoba, Newfoundland and Labrador, Nova Scotia and British Columbia all recorded YoY declines, which may indicate improving or stabilizing credit conditions in parts of the country.
| Ranking Consumer-Level Delinquency Rate (90+ Days Past Due) On Any Credit Product by Province | ||||
| Q1 2024 | Q1 2025 | Q1 2026 | Y/Y | |
| Canada | 1.76% | 1.88% | 1.86% | -2 |
| AB | 2.21% | 2.37% | 2.43% | 6 |
| NB | 2.16% | 2.13% | 2.03% | -10 |
| ON | 1.82% | 2.00% | 2.00% | 0 |
| MB | 2.11% | 2.13% | 1.96% | -17 |
| NS | 2.06% | 2.04% | 1.95% | -9 |
| SK | 2.00% | 1.97% | 1.95% | -2 |
| NL | 2.00% | 1.91% | 1.79% | -12 |
| PEI | 1.86% | 1.85% | 1.76% | -9 |
| BC | 1.69% | 1.76% | 1.71% | -5 |
| QC | 1.29% | 1.37% | 1.36% | -1 |
| Source: TransUnion Canada Credit Database | ||||
Mortgage Balances Continued to Grow as Delinquency Normalizes Amid Renewals
Mortgage balances continued to grow, with total outstanding balances rising 3.85% YoY to $1.91 trillion. The average mortgage balance also increased 4.3% to $290,528, which may reflect ongoing affordability pressures.
Mortgage delinquencies have also trended upward through late 2025 and into early 2026, with the national 90+ day rate reaching 0.19% in Q1 2026, up from 0.16% a year earlier. Despite this recent increase, delinquency rates remain broadly consistent with pre-pandemic levels.
| Historical Mortgage Delinquency Rates | |||
| Q1 2019 | Q1 2023 | Q1 2026 | |
| 30+ Days past Due | 0.55% | 0.35% | 0.50% |
| 60+ Days Past Due | 0.28% | 0.17% | 0.28% |
| 90+ Days Past Due | 0.18% | 0.11% | 0.19% |
| Source: TransUnion Canada Credit Database | |||
Balance-level delinquency has risen faster than account-level delinquency, with the 30+, 60+ and 90+ days past due balance-level delinquency rate increasing 13.8%, 23.9% and 29.3% YoY respectively. This suggests that higher-balance loans are disproportionately represented in delinquency, amplifying potential loss severity even as overall delinquency rates remain contained.
Mortgage delinquency trends varied across Canada, suggesting localized pressure rather than widespread deterioration. Ontario and Prince Edward Island saw the largest increases in early‑stage delinquency, while British Columbia experienced modest growth and Quebec remained stable.
In contrast, most Prairie provinces and parts of Atlantic Canada recorded lower delinquency rates, led by Newfoundland and Labrador, Alberta and Saskatchewan. Despite these improvements, delinquency levels remained highest in Saskatchewan and Newfoundland and Labrador, highlighting continued regional variation in mortgage performance.
| Mortgage 30+ Day Delinquency By Province | |||||
| Q1 2025 | Q1 2026 | YoY (bps) | |||
| PE | 0.49 | % | 0.57 | % | 8 |
| ON | 0.46 | % | 0.54 | % | 7 |
| BC | 0.41 | % | 0.44 | % | 3 |
| NB | 0.58 | % | 0.59 | % | 1 |
| QC | 0.39 | % | 0.39 | % | 0 |
| NS | 0.61 | % | 0.59 | % | -1 |
| MB | 0.60 | % | 0.58 | % | -2 |
| AB | 0.62 | % | 0.58 | % | -4 |
| SK | 0.68 | % | 0.64 | % | -4 |
| NL | 0.68 | % | 0.63 | % | -6 |
| Source: TransUnion Canada Credit Database | |||||
“While delinquency rates remain low by historical standards, the upward trend may reflect increasing affordability pressures as higher interest rates, elevated housing costs and persistent cost‑of‑living challenges continue to weigh on household finances, particularly in higher‑priced urban markets,” Fabian said. “Delinquencies remain historically low, but rising balance sizes and affordability pressure are beginning to show, potentially indicating a gradual shift toward higher‑severity risk, particularly in Canada’s more expensive housing markets.”
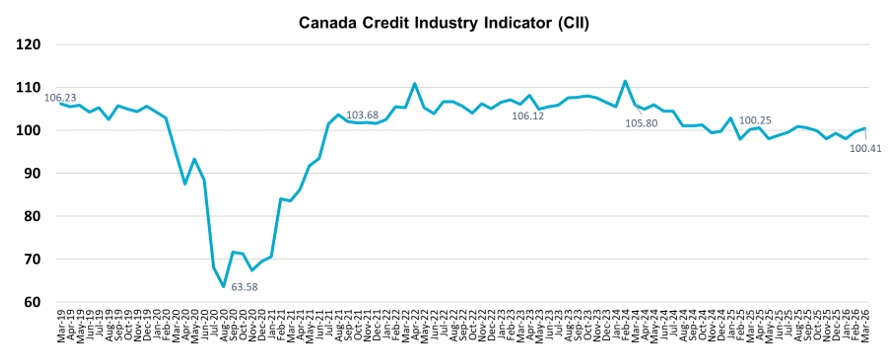
Consumer Credit Index Remains Flat Year-Over-Year Despite Slow Long-Term Decline
In Q1 2026, Canada’s Consumer Credit Industry Indicator (CII) rose one point from the prior quarter but remained unchanged YoY at 100.4. This stability may reflect a combination of continued positive balance behavior, a slight rise in delinquency rates and consistent levels of credit supply and demand. However, over the long term, the CII has been gradually declining from its post-pandemic peak in 2023.
Source: TransUnion Canada Credit Database
For more information or to request an interview, contact:
Manahil Munim
Manahil.Munim@edelmansmithfield.com
(416) 676-1390
A photo accompanying this announcement is available at https://www.globenewswire.com/NewsRoom/AttachmentNg/7d23bdee-79c7-46c4-ba11-4f6be29c05e7
![]()
