Discovery Reports 63,154 Ounces Of Gold Production, $86.8 Million Of Free Cash Flow(1) In Q3 2025
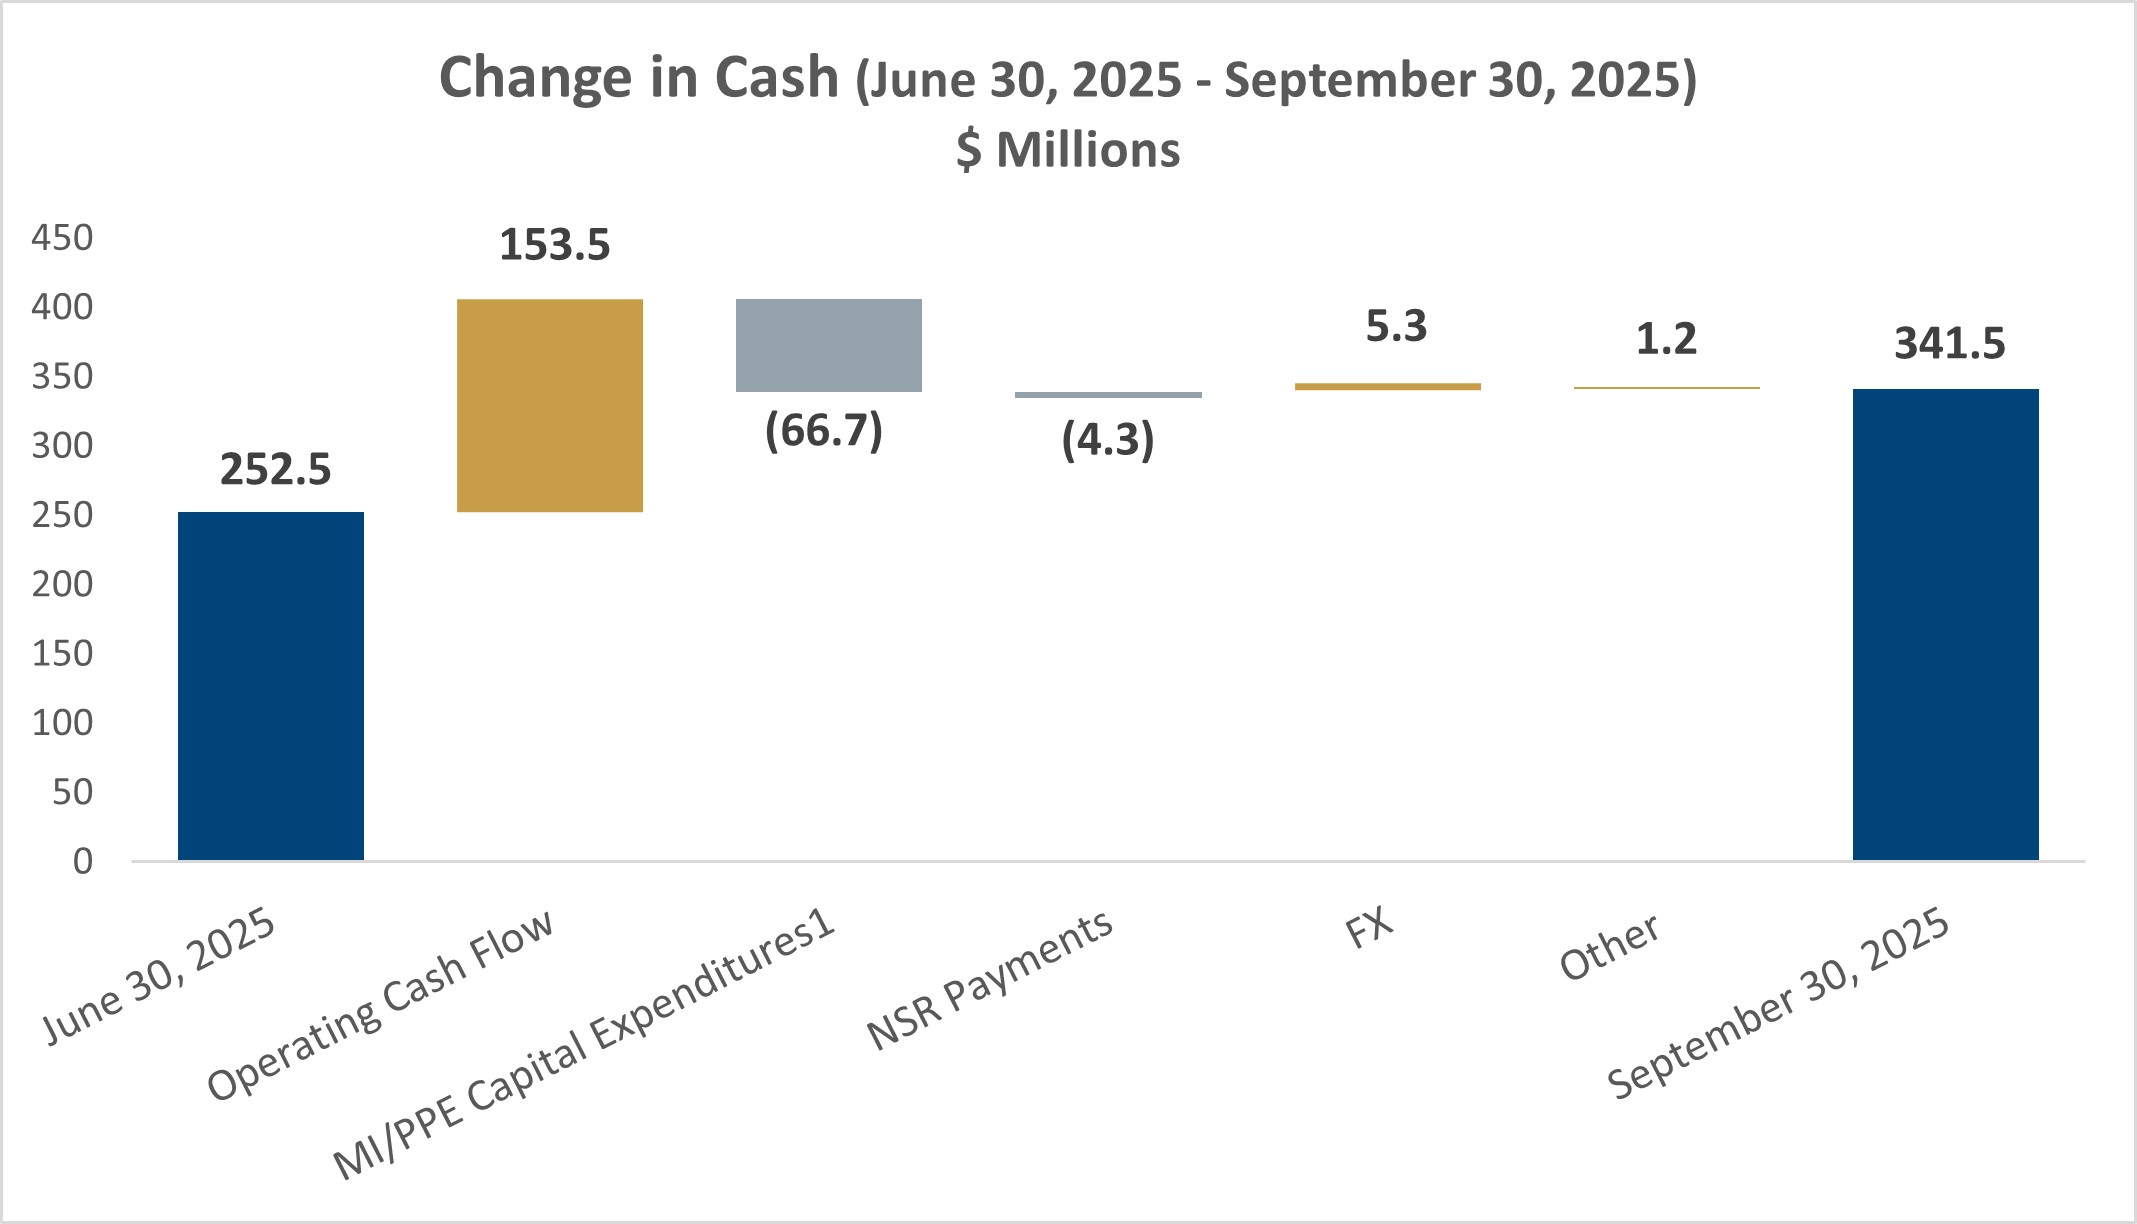
Cash of $341.5 million at September 30, 2025
- Q3 2025 NET EARNINGS AND EPS
- Net earnings of $42.4M ($0.05/share) versus net loss of $3.9M ($0.01/share) in Q3 2024; Adjusted net earnings1 totaled $61.1 million or $0.08/share.
- GOLD PRODUCTION IN Q3 2025
- 63,154 oz produced compared to 50,552 oz in Q2 2025 (from April 16 – June 30).
- OPERATING CASH COSTS IN LINE WITH EXPECTATIONS
- Operating cash costs1 of $1,339/oz sold versus $1,341/oz in Q2 2025.
- ATTRACTIVE MARGINS DRIVE PROFITABILITY AND CASH FLOW
- All-in sustaining costs (“AISC”)1 averaged $1,734/oz sold compared to an average realized gold price1 of $3,489/oz; Site-level AISC2 averaged $1,699/oz sold.
- STRONG CASH FLOW FROM GOLD SALES
- Net cash from operating activities of $153.5M; Free cash flow1 of $86.8M.
- SOLID CASH POSITION TO SUPPORT OPERATIONS AND GROWTH PLANS
- Cash at September 30, 2025, totaled $341.5M, with working capital of $224.2 million.
- NEW REVOLVING CREDIT FACILITY (“RCF”) PROVIDES INCREASED LIQUIDITY
- New RCF will allow Discovery to borrow up to $250 million, with an accordion feature for an additional $100 million. The agreement is expected to close in Q4 2025.
- ENCOURAGING EXPLORATION RESULTS RELEASED SUBSEQUENT TO QUARTER END
- Resource conversion and expansion drilling at Hoyle Pond, Borden and Pamour returns excellent results; Encouraging drill results at Owl Creek confirm potential for significant high-grade mineralization west of Hoyle Pond.
- Example of Non-GAAP measure. See the section in this press release entitled, “NON-GAAP MEASURES” for more information.
- Site-level AISC includes corporate G&A allocation and excludes remaining corporate G&A, share-based compensation costs and corporate-level sustaining capital expenditures.
TORONTO, Nov. 12, 2025 (GLOBE NEWSWIRE) — Discovery Silver Corp. (TSX: DSV, OTCQX: DSVSF) (“Discovery” or the “Company”) today announced the Company’s financial and operating results for the third quarter (“Q3 2025”) and first nine months (“YTD 2025”) of 2025. Discovery began reporting the results of gold production and sales following the Company’s acquisition (“Acquisition” or “Porcupine Acquisition”) of the Porcupine Complex (“Porcupine”) in and near Timmins, Ontario on April 15, 2025. The Company’s full financial statements and management discussion & analysis are available on SEDAR+ at www.sedarplus.ca and on the Company’s website at www.discoverysilver.com. All dollar amounts are in US dollars, unless otherwise noted.
Tony Makuch, Discovery’s CEO, commented: “During Q3 2025, we generated solid operating and financial results while at the same time continuing to integrate systems, align policies and procedures, strengthen management structures and advance investment programs at Porcupine. A key highlight of the third quarter was cash flow, with net cash from operating activities of $153.5 million and free cash flow1 totaling $86.8 million. Strong cash flow resulted from a 56% increase in gold sales, to 66,200 ounces from 42,550 ounces the previous quarter, and an increase in the average realized gold price1, to $3,489 per ounce sold. Driven by strong cash flow generation, we grew our cash position by 35%, to $341.5 million at September 30, 2025. With our current cash, as well as a new revolving credit facility for $250 million, plus a $100 million accordion feature, Discovery is very well capitalized as it moves forward with investment plans aimed at growing production, improving costs and maximizing value creation at Porcupine.
“A key component of the tremendous potential at Porcupine involves exploration. Last week, we issued our first exploration update, which included excellent drill results from resource conversion and expansion drilling at Hoyle Pond, Borden and Pamour, as well as very encouraging results at Owl Creek, which confirm the presence of high-grade mineralization three kilometers to the west of Hoyle Pond. We also announced the commencement of drilling programs at Dome Mine and the TVZ Zone. Dome and TVZ have the potential to become two new mining operations that could substantially grow production and value creation in Timmins. Drilling at Dome and TVZ is being conducted as part of studies to more thoroughly evaluate the projects, with these studies targeted for completion in 2026.”
SUMMARY OF Q3 AND YTD 2025 PERFORMANCE
| Three months ended | Nine months ended | |||||||||
| In $ thousands except per share amounts | September 30, 2025 | September 30, 2024 | June 30, 2025 | September 30, 2025 | September 30, 2024 | |||||
| Revenue | 236,961 | — | 142,010 | 378,971 | — | |||||
| Production costs | 106,807 | — | 54,919 | 161,726 | — | |||||
| Earnings (loss) before income taxes | 71,114 | (3,860) | 24,510 | 89,172 | (9,503) | |||||
| Net earnings (loss) | 42,439 | (3,860) | 5,534 | 41,521 | (9,503) | |||||
| Basic earnings (loss) per share | 0.05 | (0.01) | 0.01 | 0.06 | (0.02) | |||||
| Diluted earnings (loss) per share | 0.05 | (0.01) | 0.01 | 0.06 | (0.02) | |||||
| Cash flow from (used in) operating activities | 153,488 | (1,192) | 67,081 | 214,492 | (12,206) | |||||
| Cash investment on mine development and PPE | (66,675) | (2,280) | (39,766) | (110,208) | (7,723) | |||||
| Three months ended | Nine months ended | |||||||||||
| September 30, 2025 | September 30, 2024 | June 30 2025 | September 30, 2025 | September 30, 2024 | ||||||||
| Tonnes milled | 808,688 | — | 508,791 | 1,317,480 | — | |||||||
| Average Grade (g/t Au) | 2.69 | — | 3.39 | 2.96 | — | |||||||
| Recovery (%) | 90.3 | — | 91.3 | 90.7 | — | |||||||
| Gold produced (oz) | 63,154 | — | 50,552 | 113,706 | — | |||||||
| Gold sold (oz) | 66,200 | — | 42,550 | 108,750 | — | |||||||
| Average realized price ($/oz sold)(1) | $ | 3,489 | $ | — | $ | 3,337 | $ | 3,430 | $ | — | ||
| Operating cash costs per ounce sold ($/oz sold)(1)(2) | $ | 1,339 | $ | — | $ | 1,341 | $ | 1,340 | $ | — | ||
| AISC per ounce sold ($/oz sold)(1)(2)(3) | $ | 1,734 | $ | — | $ | 2,074 | $ | 1,863 | $ | — | ||
| Adjusted net earnings(1) | $ | 61,090 | $ | (2,336 | ) | $ | 28,434 | $ | 86,479 | $ | (6,414 | ) |
| Adjusted net earnings per share(1) | $ | 0.08 | $ | (0.01 | ) | $ | 0.04 | $ | 0.13 | $ | (0.02 | ) |
| Free cash flow(1) | $ | 86,813 | $ | (3,472 | ) | $ | 27,315 | $ | 104,284 | $ | (19,929 | ) |
(1) Example of Non-GAAP measure. See the section in this press release entitled, “NON-GAAP MEASURES” for more information.
(2) For Q2 2025, ounces sold and the cash payments in the operating cash costs per ounce sold and AISC per ounce sold calculations that related to the Franco Royalty arrangement have been excluded. See the section in this press release entitled, “NON-GAAP MEASURES” for more information.
(3) YTD 2025 results exclude G&A expense, share-based compensation costs and sustaining capital expenditures and lease expense incurred prior to April 15, 2025, the completion date of the Porcupine Acquisition.
Q3 2025
- Revenue in Q3 2025 totaled $237.0 million that resulted from gold sales of 66,200 ounces at an average realized gold price1 of $3,489 per ounce.
- EBITDA1,2 of $122.1 million compared to a loss before interest, taxes and depreciation and amortization of $3.9 million in Q3 2024 and EBITDA of $55.2 million in Q2 2025. The significant improvement in EBITDA compared to the previous quarter largely reflected the favourable impact on earnings of a 67% increase in revenue from Q2 2025 and a reduction in corporate G&A costs.
- Net earnings totaled $42.4 million, or $0.05 per basic share, versus a loss of $3.9 million, or $0.01 per basic share, in Q3 2024 and net earnings of $5.5 million, or $0.01 per basic share, in Q2 2025.
- Adjusted net earnings1 totaled $61.1 million, or $0.08 per basic share, compared to adjusted net loss of $2.3 million, or $0.01 per basic share, in Q3 2024 and adjusted net earnings of $28.4 million, or $0.04 per basic share, the previous quarter. The main differences between net earnings and adjusted net earnings in Q3 2025 related to the exclusion from adjusted net earnings of the after-tax impacts of $18.5 million of purchase price allocation (“PPA”) adjustments, $3.3 million related to transition services agreement (“TSA”) costs and $1.6 million of transaction-specific business development costs, partially offset by the exclusion of $9.2 million of foreign exchange gains.
- Solid operating performance in Q3 2025:
- Production of 63,154 ounces compared to 50,552 ounces the previous quarter (76 days from April 16, 2025 to June 30, 2025)
- Gold sales of 66,200 ounces versus 42,550 ounces in Q2 2025
- Production costs of $106.8 million compared to $54.9 million the previous quarter (Q3 2025 production costs included the $18.5 million of PPA adjustments ($nil in Q2 2025) and $3.3 million of TSA costs ($2.4 million in Q2 2025).
- Operating cash costs1 averaged $1,339 per ounce sold versus $1,341 per ounce sold in Q2 2025
- All-in sustaining costs1 (“AISC”) averaged $1,734 per ounce sold compared to $2,074 per ounce sold the previous quarter; Site-level AISC in Q3 2025 averaged $1,699 per ounce sold versus $1,849 per ounce sold in Q2 2025. See the Operating cash costs and AISC tables in the Non-GAAP Measures section near the end of this press release for more information.
- Cash flows included net cash from operating activities of $153.5 million, which compared to net cash used in operating activities of $1.2 million in Q3 2024 and net cash from operating activities of $67.1 million the previous quarter.
- Free cash flow1 totaled $86.8 million versus free cash flow of ($3.5) million in Q3 2024 and $27.3 million in Q2 2025.
- Capital expenditures1 in Q3 2025 totaled $65.2 million, with an additional $1.4 million of finance leases. Of the $65.2 million, $20.8 million related to sustaining capital expenditures1, while $44.4 million were growth capital expenditures1. Sustaining capital expenditures were largely focused on capital development at Hoyle Pond and Borden and construction work to raise and buttress the No. 6 tailings management area (“TMA6”) at the Dome property. Growth capital expenditures primarily related to pre-stripping at Pamour and longer-term investments at the TMA6.
- Cash at September 30, 2025, totaled $341.5 million compared to $252.5 million at June 30, 2025, with the increase in cash mainly resulting from the $86.8 million of free cash flow generated during Q3 2025.
- Working capital1 at September 30, 2025 totaled $224.2 million as compared to working capital of $17.0 million at December 31, 2024 and $225.9 million at June 30, 2025. The 35% increase in cash during Q3 2025 was offset by lower inventory levels as well as higher current tax payable, employee-related benefits and other current liabilities in accounting for the change in working capital compared to June 30, 2025.
(1) Represents cash capital expenditures incurred during Q3 2025
YTD 2025
Discovery did not generate revenue or earnings from mine operations in YTD 2024 or Q1 2025.
- Gold production totaled 113,706 ounces, while gold sales totaled 108,750 ounces. Revenue of $379.0 million resulted from gold sales and an average realized price of $3,430 per ounce. Production costs totaled $161.7 million. Operating cash costs averaged $1,340 per ounce sold, while AISC per ounce sold averaged $1,863.
- EBITDA was $171.0 million versus a loss before interest, taxes and depreciation and amortization of $9.5 million in YTD 2024, with earnings generated following the Porcupine Acquisition in Q2 2025 mainly accounting for the significant improvement in EBITDA performance.
- Net earnings totaled $41.5 million, or $0.06 per basic share, versus net loss of $9.5 million, or $0.02 per basic share, in YTD 2024, with the prior year net loss largely resulting from corporate G&A costs, share-based compensation expense and foreign exchange losses during YTD 2024.
- Average basic shares outstanding were 648.0 million shares versus 399.5 million shares for the same period a year earlier, with the increase mainly due to the impact of the 401.8 million shares issued during Q2 2025 in relation to the Porcupine Acquisition and the Company’s Financing Package.
- Adjusted net earnings were $86.5 million, or $0.13 per basic share, respectively, compared to adjusted net loss of $6.4 million, or $0.02 per share, in YTD 2024. The difference between net earnings and adjusted net earnings in YTD 2025 mainly reflected the exclusion from adjusted net earnings of the after-tax impacts of $21.8 million of transaction-specific business development expenses primarily related to the Porcupine Acquisition, the $18.5 million of PPA adjustments and $5.7 million of TSA costs.
- Net cash from operating activities in YTD 2025 totaled $214.5 million, while free cash flow totaled $104.3 million.
- Total capital expenditures totaled $112.5 million, with an additional $2.2 million of finance leases. Of the $112.5 million of capital expenditures, $37.0 million related to sustaining capital expenditures and $75.5 million were growth capital expenditures. Porcupine accounted for $70.8 million of growth capital expenditures in YTD 2025, mainly reflecting pre-stripping at Pamour and TMA6 expenditures. Growth capital expenditures at Cordero totaled $4.7 million, which largely related to land acquisition.
(1) Example of Non-GAAP measure. See the section of this press release entitled, “NON-GAAP MEASURES” for more information.
(2) Refers to earnings before interest, taxes and depreciation and amortization.
Income Statement Summary
| Three months ended | Nine months ended | ||||||||||||||
| September 30, 2025 | September 30, 2024 | June 30, 2025 | September 30 2025 | September 30, 2024 | |||||||||||
| Revenue | $ | 236,961 | $ | – | $ | 142,010 | $ | 378,971 | $ | – | |||||
| Production costs | 106,807 | – | 54,919 | 161,726 | – | ||||||||||
| Depreciation and amortization | 35,826 | – | 16,384 | 52,210 | – | ||||||||||
| Royalties | 3,619 | – | 1,916 | 5,535 | – | ||||||||||
| Earnings from mining operations | 90,709 | – | 68,791 | 159,500 | – | ||||||||||
| Expenses | |||||||||||||||
| General and administration | 6,661 | 2,017 | 22,877 | 35,012 | 5,658 | ||||||||||
| Exploration | 5,972 | 158 | 830 | 6,827 | 375 | ||||||||||
| Impairment | 2,140 | — | — | 2,140 | — | ||||||||||
| Share-based compensation | 1,398 | 676 | 1,953 | 4,518 | 2,022 | ||||||||||
| Earnings from operations | 74,538 | (2,851 | ) | 43,131 | 111,003 | (8,055 | ) | ||||||||
| Other | |||||||||||||||
| Other income (loss) | 9,301 | (1,327 | ) | (6,879 | ) | 2,611 | (2,778 | ) | |||||||
| Finance Items | |||||||||||||||
| Finance expense, net | (12,725 | ) | 318 | (11,742 | ) | (24,442 | ) | 1,330 | |||||||
| Earnings before taxes | 71,114 | (3,860 | ) | 24,510 | 89,172 | (9,503 | ) | ||||||||
| Income taxes expense | 28,675 | – | 18,976 | 47,651 | – | ||||||||||
| Net (loss) earnings | $ | 42,439 | $ | (3,860 | ) | $ | 5,534 | $ | 41,521 | $ | (9,503 | ) | |||
| Basic earnings per share | $ | 0.05 | $ | (0.01 | ) | $ | 0.01 | $ | 0.06 | $ | (0.02 | ) | |||
| Diluted earnings per share | $ | 0.05 | $ | (0.01 | ) | $ | 0.01 | $ | 0.06 | $ | (0.02 | ) | |||
| Weighted average number of common shares outstanding (in 000’s) | |||||||||||||||
| Basic | 802,837 | 397,696 | 735,616 | 647,997 | 399,538 | ||||||||||
| Diluted | 825,798 | 397,696 | 762,923 | 670,958 | 399,538 | ||||||||||
PORCUPINE OPERATIONS REVIEW
Discovery’s Porcupine Operations cover approximately 1,400 km2 in and near Timmins, Ontario. Porcupine consists of the Hoyle Pond, Pamour and Hollinger mine properties, the Dome mine property and milling facility, and numerous near-mine and regional exploration targets. The Complex also includes the Borden mine property and large land position near Chapleau, Ontario. Current operations include the Hoyle Pond and Borden underground mines, with the Pamour open-pit project currently ramping up towards commercial levels of production. All mineralization is processed at the Dome, including mineralization from Borden, which is trucked 190 km to the mill. The Dome Mill is a 12,000 tonne-per-day processing facility that in recent years has operated at rates well below optimal levels. Through investment programs launched following the closing of the Porcupine Acquisition, the Company is targeting a return to full capacity operations by 2028 or sooner.
| Three months ended | Nine months ended | ||||||||
| Porcupine Complex | September 30, 2025 | June 30, 2025 | September 30, 2025 | ||||||
| Ore processed (t) | 808,688 | 508,791 | 1,317,480 | ||||||
| Average Grade (g/t Au) | 2.69 | 3.39 | 2.96 | ||||||
| Recovery (%) | 90.3% | 91.3% | 90.7% | ||||||
| Gold produced (oz)1 | 63,154 | 50,552 | 113,706 | ||||||
| Gold poured (oz)1 | 65,978 | 46,608 | 112,586 | ||||||
| Gold sold (oz)1 | 66,200 | 42,550 | 108,750 | ||||||
| Milling operating costs ($ Millions) | $ | 17,107 | $ | 12,861 | $ | 29,968 | |||
| Operating costs per tonne processed ($/tonne) | $ | 21.2 | $ | 25.4 | $ | 22.7 | |||
| Production costs | 106,807 | 54,919 | 161,726 | ||||||
| Operating cash costs per ounce sold2,3 | 1,339 | 1,341 | 1,340 | ||||||
| AISC per ounce sold2,3 | 1,699 | 1,849 | 1,756 | ||||||
| Total capital expenditures2,3(in thousands) | 65,976 | 41,632 | 107,608 | ||||||
(1) Includes gold production, poured and sold from Hoyle Pond, Borden and Pamour.
(2) Example of Non-GAAP measure. See the section in this press release entitled, “NON-GAAP MEASURES” for more information.
(3) Operating cash costs per ounce sold, AISC per ounce sold and total capital expenditures are site level and exclude remaining corporate G&A, share-based compensation costs and corporate-level sustaining capital expenditures.
During Q3 2025, a total of 808,688 tonnes were processed at Porcupine Complex at an average grade of 2.69 g/t, with recovery rates averaging 90.3%, which compared to 508,791 tonnes at an average grade of 3.39 g/t and recovery rates averaging 91.3% for the 76 days from April 16, 2025 to June 30, 2025 in Q2 2025. A total of 63,154 ounces of gold were produced over this period, with total gold poured of 65,978 ounces, compared to 50,552 and 46,608 ounces produced and poured respectively, in the previous quarter. Higher production in Q3 2025 mainly reflected the favourable impact of increased mining rates and higher average grades at both Borden and Pamour, partially offset by a reduction in mining rates and average grades at Hoyle Pond. During Q3 2025, production at Hoyle Pond was impacted by ventilation constraints during a period of high temperatures, which limited access to higher-grade area of the S Zone Deep.
Availability rates at the Dome Mill during Q3 2025 were impacted by a scheduled five-day maintenance shutdown in July for the purpose of replacing the discharge head and shell of B Rod Mill, rebuild of the tertiary crusher, and feeder repairs at the coarse ore stockpile. The Company used the occasion of the shutdown to advance multiple other projects, primarily in the grinding water system, repair to the mill reclaim water pond and carbon handling circuits. Based on operating days during Q3 2025, mill throughput averaged approximately 9,295 tonnes per day. Mill operating costs during Q3 2025 totaled $17.1 million for an average of $21.15 per tonne processed, which compared to $12.9 million and an average of $25.4 per tonne, respectively, the previous quarter, with the improvement in operating costs per tonne resulting from the 59% increase in tonnes processed. Mill costs are allocated to the mine operations based on a proportion of total tonnes processed.
For YTD 2025 a total of 1,317,480 tonnes were processed at Dome Mill at an average grade of 2.96 g/t, with recovery rates averaging 90.7%. A total of 113,706 ounces of gold were produced over this period, with total gold poured of 112,586 ounces. Total mill operating costs were $30.0 million for YTD 2025, for an average of $22.75 per tonne processed. The mill costs are allocated to the mine operations based on a proportion of total tonnes processed.
Production costs, including mining and processing costs, in Q3 2025 totaled $106.8 million versus $54.9 million in the previous quarter. Operating cash costs1 averaged $1,339 compared to $1,341 in the previous quarter. Site-level AISC1,2 averaged $1,699 per ounce sold compared to $1,849 in Q2 2025. Included in Q3 2025 AISC was $22.1 million of sustaining capital expenditures1, mainly related to capital development activities and capital expenditures related to the TMA6, which increased from $14.8 million in Q2 2025. The improvement in AISC was due to a 63% increase in ounces of gold sold, lower accretion and amortization of site closure provisions, partially offset by higher sustaining capital expenditures.
For YTD 2025, production costs totaled $161.7 million, with operating cash costs averaging $1,340 per ounce sold and AISC averaging $1,756 per ounce sold. Included in AISC were $36.8 million of sustaining capital expenditures related to capital development and expenditures related to the TMA6.
(1) Example of Non-GAAP measure. See the section in this press release entitled, “NON-GAAP MEASURES” for more information.
(2) Site-level AISC includes corporate G&A allocation and excludes remaining G&A, share-based compensation costs and corporate-level sustaining capital expenditures.
CORDERO OVERVIEW
The Cordero Project was acquired by Discovery in 2019. Since that time, the Company has invested over $100.0 million in Mexico, conducting significant exploration drilling and technical analysis, leading to the release of multiple studies, most recently the feasibility study (“FS”) dated February 16, 2024 and filed on SEDAR+ (www.sedarplus.ca) on March 28, 2024. The results of the FS confirmed Cordero to be one of the world’s largest undeveloped silver deposits, with the potential for large-scale production at low unit costs and that is capable of generating substantial free cash flow and attractive economic returns.
Key highlights of the FS include:
- Average annual production of 37.0 million silver equivalent ounces1(“AgEq”) over the first 12 years with a total project life of 19 years;
- AISC2 averaging below $12.50 per AgEq ounce in Years 1 – 8;
- Base-case after-tax net present value (“NPV”) of $1.2 billion (Base-case metal prices: Silver – $22.00 per ounce; Gold – $1,600 per ounce; Zinc – $1.20 per ounce; Lead – $1.00 per ounce);
- Initial capital expenditures2 of $606.0 million (resulting in a NPV to capital ratio of 2:1);
- Large-scale Mineral Reserve totaling 302.0 million ounces of silver, 840,000 ounces of gold, 5.2 billion pounds of zinc and 3.0 billion pounds of lead;
- Important socio-economic contribution to Mexico, including an initial investment of over $600 million, the creation of 2,500 jobs during development, and over 1,000 jobs during operations, $4.0 billion in total procurement, all to remain within Mexico, and, assuming a fixed $35.00 per ounce silver price, total tax contributions within Mexico of $2.4 billion over the project life; and,
- High levels of environmental responsibility and a commitment to contributing to the management of key social issues such as carbon reduction and water quality and availability.
Third Quarter 2025 Highlights
During Q3 2025, Discovery continued work on key initiatives to further de-risk the project, including:
- Assessing the potential to use natural gas power sources versus the grid power supply expected to complete in Q4;
- Advancing geotechnical (completed in early Q4) and other work related to the planned upgrade of the local water treatment plant;
- Evaluating the potential to establish solar farms around the project site to contribute to the power supply required for mine development and operation; and,
- Participation in ongoing discussions with the various governmental bodies involved in issuing the permits for the project.
(1) AgEq produced is metal recovered in concentrate. AgEq is calculated as Ag + (Au x 72.7) + (Pb x 45.5) + (Zn x 54.6); these factors are based on metal prices of Ag – $22/oz, Au – $1,600/oz, PB – $1,00/lb and Zn – $1.20/lb (2) use in the February 2024 FS.
Example of Non-GAAP measure. See the section in this press release entitled, “NON-GAAP MEASURES” for more information.
OUTLOOK
With the closing of the Porcupine Acquisition on April 15, 2025, Discovery was transformed into a diversified North American-focused precious metals producer combining growing gold production in Northern Ontario, Canada, with one of the world’s largest silver development projects in Chihuahua State, Mexico.
Key priorities for the Porcupine Operations in 2025 continue to include:
- Implementing investment plans aimed at growing mining rates, increasing production levels and lowering unit costs at Hoyle Pond and Borden;
- Ensuring the successful ramp up of production at Pamour;
- Advancing studies on the TVZ zone, Dome Mine project and Dome Mill expansion; and,
- Advancing numerous exploration opportunities at each of site, as well as at regional targets.
The Company is currently executing a 140,000-metre drill program, which is expected to be completed early in 2026. The goals for the drilling program include resource conversion and expansion at Hoyle Pond, Borden and Pamour, in support of an updated technical report, to be issued in 2026, as well as the evaluation of district level targets, including Owl Creek, located approximately three kilometers west of Hoyle Pond. In addition, drilling is also being conducted at both Dome Mine and the TVZ Zone as part of studies to further advance and evaluate these high-potential targets.
With $341.5 million of cash at September 30, 2025, and the $250 million RCF, the Company is well capitalized to fund growth and optimization plans for Porcupine and current expenditure plans at Cordero.
In Mexico, the Company plans to further advance and de-risk the Cordero project, with key areas of focus being power, water availability and management, permitting, and the continuation of ESG and community outreach programs.
Following the completion of the land acquisition program in March 2025, the next major milestone for Cordero will be approval of the Company’s Environmental Impact Assessment or MIA by SEMARNAT, which was submitted in August 2023. The MIA passed SEMARNAT’s legal review soon after its submission and was advanced for technical review. As of the date of this press release, the Company had completed the technical review process and was awaiting approval of the MIA. The Company remains confident that Cordero will receive MIA approval.
ABOUT DISCOVERY
Discovery is a growing North American-focused precious metals company. The Company has exposure to silver through its first asset, the 100%-owned Cordero project, one of the world’s largest undeveloped silver deposits, which is located close to infrastructure in a prolific mining belt in Chihuahua State, Mexico. On April 15, 2025, Discovery completed the acquisition of the Porcupine Complex from Newmont Corporation, transforming the Company into a new Canadian gold producer with multiple operations in one of the world’s most renowned gold camps in and near Timmins, Ontario. Discovery owns a dominant land position within the camp, with a large base of Mineral Resources remaining and substantial growth and exploration upside.
On Behalf of the Board of Directors,
Tony Makuch, P.Eng
President, CEO & Director
For further information contact:
Mark Utting, CFA
SVP Investor Relations
Phone: 416-806-6298
Email: mark.utting@discoverysilver.com
Website: www.discoverysilver.com
QUALIFIED PERSON
The scientific and technical information in this press release was reviewed and approved by Pierre Rocque, P.Eng., Chief Operating Officer of the Company and Eric Kallio, P.Geo., Senior Vice President, Exploration of the Company, who are recognized as a Qualified Persons (“QPs”) under the guidelines of National Instrument 43-101 – Standards of Disclosure for Mineral Projects (“NI 43-101”).
Scientific and technical information in this press release with respect to the Company’s Cordero project has been prepared and presented based on the technical report entitled “Cordero Silver Project, Technical Report and Feasibility Study” with an effective date of February 16, 2024, as filed on SEDAR+ (the “Feasibility Study”) which was completed by Ausenco Engineering Canada ULC, with support of AGP Mining Consultants Inc., WSP USA Inc. and RedDot3D Inc. The mineral reserve estimate was completed under the supervision of Wille Hamilton, P.Eng. Of AGP and the mineral resource estimate was completed under the supervision of R. Mohan Srivastava, P.Geo, both of whom are independent QPs as such term is defined in NI 43-101.
NON-GAAP MEASURES
The Company has included certain non-GAAP measures in this document, as detailed below. In the mining industry, these are common performance measures and ratios but may not be comparable to similar measures or ratios presented by other issuers and the non-GAAP measures and ratios do not have any standardized meaning. Accordingly, these measures and ratios are included to provide additional information and should not be considered in isolation or as a substitute for measures of performance prepared in accordance with IFRS Accounting Standards. These measures do not have any standardized meaning prescribed under IFRS, and therefore may not be comparable to other issuers.
Free Cash Flow
Free Cash Flow is a non-GAAP performance measure that is calculated as cash flows from operations net of cash flows invested in mineral property, plant, and equipment and exploration and evaluation assets. The Company believes that this measure is useful to the external users in assessing the Company’s ability to generate cash flow after capital investments and build the cash resources of the Company.
Free cash flow is reconciled to the amounts include in the Consolidated Statements of Cash Flows as follows:
| Three months ended | Nine months ended | ||||||||||||||
| Sept. 30, 2025 | Sept. 30, 2024 | June 30, 2025 | Sept. 30, 2025 | Sept. 30, 2024 | |||||||||||
| $ Thousands | |||||||||||||||
| Net cash provided by operating activities | $ | 153,488 | $ | (1,192 | ) | $ | 67,081 | $ | 214,492 | $ | (12,206 | ) | |||
| Mineral interests and PPE additions | (66,675 | ) | (2,280 | ) | (39,766 | ) | (110,208 | ) | (7,723 | ) | |||||
| Free cash flow | $ | 86,813 | $ | (3,472 | ) | $ | 27,315 | $ | 104,284 | $ | (19,929 | ) | |||
Sustaining and Growth Capital
Sustaining capital and growth capital are non-GAAP measures. Sustaining capital is defined as capital required to maintain current operations at existing levels. Growth capital is defined as capital expenditures for major growth projects or enhancement capital for significant infrastructure improvements at existing operations. Both measurements are used by management to assess the effectiveness of investment programs.
| Three months ended | Nine months ended | |||||||||
| Sept. 30, | Sept. 30, | June 30 | Sept. 30 | Sept. 30, | ||||||
| $ Thousands | 2025 | 2024 | 2025 | 2025 | 2024 | |||||
| Sustaining capital | $ | 20,799 | $ | – | $ | 66,122 | $ | 36,957 | $ | – |
| Growth capital | 44,351 | 2,416 | 28,053 | 75,495 | 7,979 | |||||
| Finance leases related to IFRS 16 | 1,413 | – | 36 | 2,184 | – | |||||
| Total capital expenditures | $ | 66,563 | $ | 2,416 | $ | 44,211 | $ | 114,636 | $ | 7,979 |
Operating Cash Costs and Operating Cash Costs per Ounce Sold
Operating cash costs and operating cash costs per ounce sold are non-GAAP measures. In the gold mining industry, these metrics are common performance measures but do not have any standardized meaning under GAAP. Operating cash costs include mine site operating costs such as mining, processing, administration and royalty expenses but exclude depreciation and depletion and reclamation costs. Operating cash cost per ounce sold is based on ounces sold and is calculated by dividing operating cash costs by volume of gold ounces sold.
The Company discloses operating cash costs and operating cash cost per ounce sold as it believes the measures provide valuable assistance to investors and analysts in evaluating the Company’s operational performance and ability to generate cash flow. The most directly comparable measure prepared in accordance with GAAP is production costs. Operating cash costs and operating cash costs per ounce sold should not be considered in isolation or as a substitute for measures prepared in accordance with GAAP.
AISC and AISC per Ounce Sold
AISC and AISC per ounce sold are non-GAAP measures. These measures are intended to assist readers in evaluating the total costs of producing and selling gold from current operations. While there is no standardized meaning across the industry for this measure, the Company’s definition conforms to the definition of AISC as set out by the World Gold Council in its guidance note dated June 27, 2013.
The Company defines AISC as the sum of operating costs (as defined and calculated above), sustaining capital, exploration expense, corporate expenses, lease payments relating to sustaining assets, and reclamation cost accretion and depreciation related to current operations. Corporate expenses include general and administrative expenses, net of transaction related costs, severance expenses for management changes and interest income. AISC excludes growth capital expenditures, growth exploration expenditures, reclamation cost accretion and depreciation not related to current operations, lease payments related to non-sustaining assets, interest expense, debt repayment and taxes.
Operating cash costs and AISC Reconciliation
The following tables reconciles these non-GAAP measures to the most directly comparable GAAP measures for the three and nine months ended September 30, 2025, and the three months ended June 30, 2025.
| Three months ended September 30, 2025 | ||||||
| $ Thousands unless otherwise stated | Porcupine | Corporate | Total Consolidated | |||
| Production costs | 106,807 | – | 106,807 | |||
| Royalty expense | 3,619 | – | 3,619 | |||
| TSA1 | (3,317) | – | (3,317) | |||
| PPA inventory2 | (18,493) | – | (18,493) | |||
| Operating cash costs | 88,616 | – | 88,616 | |||
| General and administrative3 | 2,483 | 2,142 | 4,625 | |||
| Share-based compensation | – | 1,398 | 1,398 | |||
| Accretion of site closure provisions | 1,303 | – | 1,303 | |||
| Amortization of site closure provision | (1,967) | – | (1,967) | |||
| Sustaining capital4 | 22,063 | (1,264) | 20,799 | |||
| Expensed exploration | — | – | – | |||
| Sustaining leases | – | 21 | 21 | |||
| AISC | 112,498 | 2,297 | 114,795 | |||
| Ounces of gold sold | 66,200 | – | 66,200 | |||
| Operating cash costs per ounce sold ($) | 1,339 | – | 1,339 | |||
| Sustaining capital expenditures per ounce sold ($) | 333 | – | 314 | |||
| AISC per ounce sold ($) | 1,699 | – | 1,734 | |||
(1) Costs not reflective of normal operations.
(2) Purchase price allocation represents the depletion of inventories acquired with the business combinations.
(3) Excludes certain items not reflective of normal operations.
(4) Includes the write-down of software.
| Nine months ended September 30, 2025 | ||||||
| $ Thousands unless otherwise stated | Porcupine | Corporate | Total Consolidated | |||
| Production costs | 161,726 | – | 161,726 | |||
| Royalty expense | 5,535 | – | 5,535 | |||
| TSA1 | (5,733) | – | (5,733) | |||
| PPA inventory2 | (18,493) | – | (18,493) | |||
| Operating cash costs | 143,035 | – | 143,035 | |||
| General and administrative3 | 2,483 | 7,974 | 10,457 | |||
| Share-based compensation | – | 3,351 | 3,351 | |||
| Accretion of site closure provisions | 3,379 | – | 3,379 | |||
| Amortization of site closure provision | 1,096 | – | 1,096 | |||
| Sustaining capital4 | 36,838 | 83 | 36,921 | |||
| Expensed exploration | 659 | – | 659 | |||
| Sustaining leases | – | 42 | 42 | |||
| AISC | 187,490 | 11,450 | 198,940 | |||
| Ounces of gold sold | 106,766 | – | 106,766 | |||
| Operating cash costs per ounce sold ($) | 1,340 | – | 1,340 | |||
| Sustaining capital expenditures per ounce sold ($) | 345 | – | 346 | |||
| AISC per ounce sold ($) | 1,756 | – | 1,863 | |||
(1) Costs not reflective of normal operations.
(2) Purchase price allocation represents the depletion of inventories acquired with the business combinations.
(3) Excludes certain items not reflective of normal operations.
(4) Corporate includes the write-down of software.
| Three months ended June 30, 2025 | ||||||
| $ Thousands unless otherwise stated | Porcupine | Corporate | Total Consolidated | |||
| Production costs | 54,919 | – | 54,919 | |||
| Royalty expense | 1,916 | – | 1,916 | |||
| TSA1 | (2,416) | – | (2,416) | |||
| PPA inventory | – | – | – | |||
| Operating cash costs | 54,419 | – | 54,419 | |||
| General and administrative2 | – | 5,832 | 5,832 | |||
| Share-based compensation | – | 1,953 | 1,953 | |||
| Accretion of site closure provisions | 2,076 | – | 2,076 | |||
| Amortization of site closure provision | 3,063 | – | 3,063 | |||
| Sustaining capital | 14,775 | 1,347 | 16,122 | |||
| Expensed exploration | 659 | – | 659 | |||
| Sustaining leases | – | 21 | 21 | |||
| AISC | 74,992 | 9,153 | 84,145 | |||
| Ounces of gold sold3 | 40,566 | – | 40,566 | |||
| Operating cash costs per ounce sold ($) | 1,341 | – | 1,341 | |||
| Sustaining capital expenditures per ounce sold ($) | 364 | – | 397 | |||
| AISC per ounce sold ($) | 1,849 | – | 2,074 | |||
(1) Costs not reflective of normal operations.
(2) Excludes certain items not reflective of normal operations.
(3) For Q2 2025, the ounces sold (1,984 ounces) and the cash payments ($6.6 million) in the operating cash costs per ounce sold and AISC per ounce sold calculations that related to the Franco Royalty arrangement have been excluded. The change to reported operating cash costs per ounce sold and AISC per ounce sold is $93 per ounce and $59 per ounce, respectively.
Average Realized Price per Ounce Sold
In the gold mining industry, average realized price per ounce sold is a common performance measure that does not have any standardized meaning. The most directly comparable measure prepared in accordance with GAAP is revenue from gold sales. Average realized price per ounces sold should not be considered in isolation or as a substitute for measures prepared in accordance with GAAP. The measure is intended to assist readers in evaluating the total revenues realized in a period from current operations.
| Three months ended | Nine months ended | |||||
| Sept. 30, 2025 | June 30, 2025 | Sept. 30, 2025 | ||||
| $ Thousands unless otherwise indicated | ||||||
| Revenue | $ | 230,993 | $ | 142,010 | $ | 373,003 |
| Ounces sold | 66,200 | 42,550 | 108,750 | |||
| Average realized price per ounce sold ($) | $ | 3,489 | $ | 3,337 | $ | 3,430 |
Adjusted Net Earnings and Adjusted Net Earnings per Share
Adjusted net earnings and adjusted net earnings per share are used by management and investors to measure the underlying operating performance of the Company. Adjusted net earnings is defined as net earnings adjusted to exclude the after-tax impact of specific items that are significant, but not reflective of the underlying operations of the Company, including foreign exchange gains and losses and other non-recurring items. Adjusted net earnings per share is calculated using the weighted average number of shares outstanding for adjusted net earnings per share.
| Three months ended | Nine months ended | ||||||||||||||
| $ Thousands unless otherwise stated | Sept. 30, 2025 | Sept. 30, 2024 | June 30, 2025 | Sept. 30, 2025 | Sept. 30, 2024 | ||||||||||
| Net earnings | $ | 42,439 | $ | (3,860) | $ | 5,534 | $ | 41,521 | $ | (9,503) | |||||
| Business development expenses | 1,638 | 255 | 16,619 | 21,792 | 334 | ||||||||||
| Foreign exchange loss (gain) | (9,162) | 1,269 | 6,821 | (2,469) | 2,755 | ||||||||||
| TSA | 3,317 | — | 2,416 | 5,733 | — | ||||||||||
| Severance | 397 | — | — | 397 | — | ||||||||||
| Impairment | 2,140 | — | — | 2,140 | — | ||||||||||
| PPA adjustment – inventory | 18,493 | — | — | 18,493 | — | ||||||||||
| Income tax related to above adjustments | 1,828 | — | (2,956) | (1,128) | — | ||||||||||
| Adjusted net earnings | $ | 61,090 | $ | (2,336) | $ | 28,434 | $ | 86,479 | $ | (6,414) | |||||
| Weighted average shares outstanding – basic (‘000s) | 802,837 | 397,696 | 735,616 | 647,997 | 399,538 | ||||||||||
| Adjusted net earnings per share ($) | $ | 0.08 | $ | (0.01) | $ | 0.04 | $ | 0.13 | $ | (0.02) | |||||
Earnings before Interest, Taxes, Depreciation, and Amortization (“EBITDA”)
EBITDA represents net earnings before interest, taxes, depreciation and amortization. EBITDA is an indicator of the Company’s ability to generate liquidity by producing operating cash flow to fund working capital needs, service debt obligations, and fund capital expenditures.
The following is a reconciliation of EBITDA to the consolidated financial statements:
| Three months ended | Nine months ended | |||||||||||
| $ Thousands | Sept. 30, 2025 | Sept. 30, 2024 | June 30, 2025 | Sept. 30, 2025 | Sept. 30, 2024 | |||||||
| Net earnings | $ | 42,439 | $ | (3,860 | ) | $ | 5,534 | $ | 41,521 | $ | (9,503 | ) |
| Add back: | ||||||||||||
| Finance costs | 15,170 | 3 | 14,307 | 29,603 | 9 | |||||||
| Depreciation and amortization | 35,826 | – | 16,384 | 52,210 | – | |||||||
| Income tax expenses (recovery) | 28,675 | – | 18,976 | 47,651 | – | |||||||
| EBITDA | $ | 122,110 | $ | (3,857 | ) | $ | 55,201 | $ | 170,985 | $ | (9,494 | ) |
Working Capital
Working capital is a non-GAAP measure. In the gold mining industry, working capital is a common measure of liquidity, but does not have any standardized meaning. The most directly comparable measure prepared in accordance with GAAP is current assets and current liabilities. Working capital is calculated by deducting current liabilities from current assets. Working capital should not be considered in isolation or as a substitute for measures prepared in accordance with GAAP. The measure is intended to assist readers in evaluating the Company’s liquidity. Working capital is reconciled to the amounts in the Consolidated Statements of Financial Position as follows:
| September 30, 2025 | December 31, 2024 | |||
| $ Thousands | ||||
| Current assets | $ | 439,406 | $ | 22,937 |
| Current liabilities | 215,181 | 5,984 | ||
| Working capital | $ | 224,225 | $ | 16,953 |
FORWARD-LOOKING STATEMENTS
Neither TSX Exchange nor its Regulation Services Provider (as that term is defined in the policies of the TSX Exchange) accepts responsibility for the adequacy or accuracy of this release.
This news release is not for distribution to United States newswire services or for dissemination in the United States.
This news release does not constitute an offer to sell or a solicitation of an offer to buy nor shall there be any sale of any of the securities in any jurisdiction in which such offer, solicitation or sale would be unlawful, including any of the securities in the United States of America. The securities have not been and will not be registered under the United States Securities Act of 1933, as amended (the “1933 Act”) or any state securities laws and may not be offered or sold within the United States or to, or for account or benefit of, U.S. Persons (as defined in Regulation S under the 1933 Act) unless registered under the 1933 Act and applicable state securities laws, or an exemption from such registration requirements is available.
Cautionary Note Regarding Forward-Looking Statements
This news release may include forward-looking statements that are subject to inherent risks and uncertainties. All statements within this news release, other than statements of historical fact, are to be considered forward looking. Although Discovery believes the expectations expressed in such forward-looking statements are based on reasonable assumptions, such statements are not guarantees of future performance and actual results or developments may differ materially from those described in forward-looking statements. Statements include but are not limited to the development of the Porcupine Operations and its attractive economics and significant exploration upside; construction decision and development, the anticipated capital and operating costs, sustaining costs, net present value, internal rate of return, the method of mining the Porcupine Operations, payback period, process capacity, average annual metal production, average process recoveries, concession renewal, permitting of the assets, anticipated mining and processing methods, feasibility study production schedule and metal production profile, anticipated construction period, anticipated mine life, expected recoveries and grades, anticipated production rates, infrastructure, social and environmental impact studies, the completion of key de-risking items, including the timing of receipt permits, availability of water and power, availability of labour, job creation and other local economic benefits, tax rates and commodity prices that would support development of the Cordero Project, and other statements that express management’s expectations or estimates of future performance, operational, geological or financial results Information concerning mineral resource/reserve estimates and the economic analysis thereof contained in the results of the feasibility study are also forward-looking statements in that they reflect a prediction of the mineralization that would be encountered, and the results of mining, if a mineral deposit were developed and mined. Forward-looking statements are statements that are not historical facts which address events, results, outcomes or developments that the Company expects to occur. Forward-looking statements are based on the beliefs, estimates and opinions of the Company’s management on the date the statements are made and they involve a number of risks and uncertainties.
Factors that could cause actual results to differ materially from those described in forward-looking statements include fluctuations in market prices, including metal prices, continued availability of capital and financing, and general economic, market access restrictions or tariffs, changes in U.S. laws and policies regarding regulating international trade, including but not limited to changes to or implementation of tariffs, trade restrictions, or responsive measures of foreign and domestic governments, changes to cost and availability of goods and raw materials, along with supply, logistics and transportation constraints, changes in general economic conditions including market volatility due to uncertain trade policies and tariffs, , the actual results of current and future exploration activities; changes to current estimates of mineral reserves and mineral resources; conclusions of economic and geological evaluations; changes in project parameters as plans continue to be refined; the speculative nature of mineral exploration and development; risks in obtaining and maintaining necessary licenses, permits and authorizations for the Company’s development stage and operating assets; the accuracy of historical and forward-looking operational and financial information estimates provided by Newmont; the Company’s ability to integrate the Porcupine Operations; statements regarding the Porcupine Operations, including the results of technical studies and the anticipated capital and operating costs, sustaining costs , internal rate of return, concession or claim renewal, the projected mine life and other attributes of the Porcupine Operations, including net present value, the timing of any environmental assessment processes, reclamation obligations; operations may be exposed to new diseases, epidemics and pandemics, including any ongoing or future effects of COVID-19 (and any related ongoing or future regulatory or government responses) and its impact on the broader market and the trading price of the Company’s shares; provincial and federal orders or mandates (including with respect to mining operations generally or auxiliary businesses or services required for operations) in Canada and Mexico, all of which may affect many aspects of the Company’s operations including the ability to transport personnel to and from site, contractor and supply availability and the ability to sell or deliver mined silver; changes in national and local government legislation, controls or regulations; failure to comply with environmental and health and safety laws and regulations; labour and contractor availability (and being able to secure the same on favourable terms); disruptions in the maintenance or provision of required infrastructure and information technology systems; fluctuations in the price of gold or certain other commodities such as, diesel fuel, natural gas, and electricity; operating or technical difficulties in connection with mining or development activities, including geotechnical challenges and changes to production estimates (which assume accuracy of projected ore grade, mining rates, recovery timing and recovery rate estimates and may be impacted by unscheduled maintenance); changes in foreign exchange rates (particularly the Canadian dollar, U.S. dollar and Mexican peso); the impact of inflation; geopolitical conflicts; employee and community relations; the impact of litigation and administrative proceedings (including but not limited to mining reform laws in Mexico, or litigations involving First Nation(s)) and any interim or final court, arbitral and/or administrative decisions; disruptions affecting operations; availability of and increased costs associated with mining inputs and labour; delays in construction decisions and any development of the Cordero Project or other projects at the Porcupine Operations; changes with respect to the intended method of mining and processing ore from the Porcupine Operations; inherent risks and hazards associated with mining and mineral processing including environmental hazards, industrial accidents, unusual or unexpected formations, pressures and cave-ins; the risk that the Company’s mines may not perform as planned; uncertainty with the Company’s ability to secure additional capital to execute its business plans; contests over title to properties; expropriation +or nationalization of property; political or economic developments in Canada and Mexico and other jurisdictions in which the Company may carry on business in the future; increased costs and risks related to the potential impact of climate change, including risks associated with increased frequency of natural disasters such as fire, floods and seismicity; the costs and timing of exploration, construction and development of new deposits; risk of loss due to sabotage, protests and other civil disturbances; the impact of global liquidity and credit availability and the values of assets and liabilities based on projected future cash flows; risks arising from holding derivative instruments; and business opportunities that may be pursued by the Company. There can be no assurances that such statements will prove accurate and, therefore, readers are advised to rely on their own evaluation of such uncertainties. Discovery does not assume any obligation to update any forward-looking statements except as required under applicable laws. The risks and uncertainties that may affect forward-looking statements, or the material factors or assumptions used to develop such forward-looking information, are described under the heading “Risks Factors” in the Company’s Annual Information Form dated March 26, 2025, which is available under the Company’s issuer profile on SEDAR+ at www.sedarplus.ca.
A photo accompanying this announcement is available at https://www.globenewswire.com/NewsRoom/AttachmentNg/010f5585-3765-4da0-a067-904cca010400
![]()
