DAT: Dry van spot rates top contract for first time since February 2022; flatbed rates hit record high
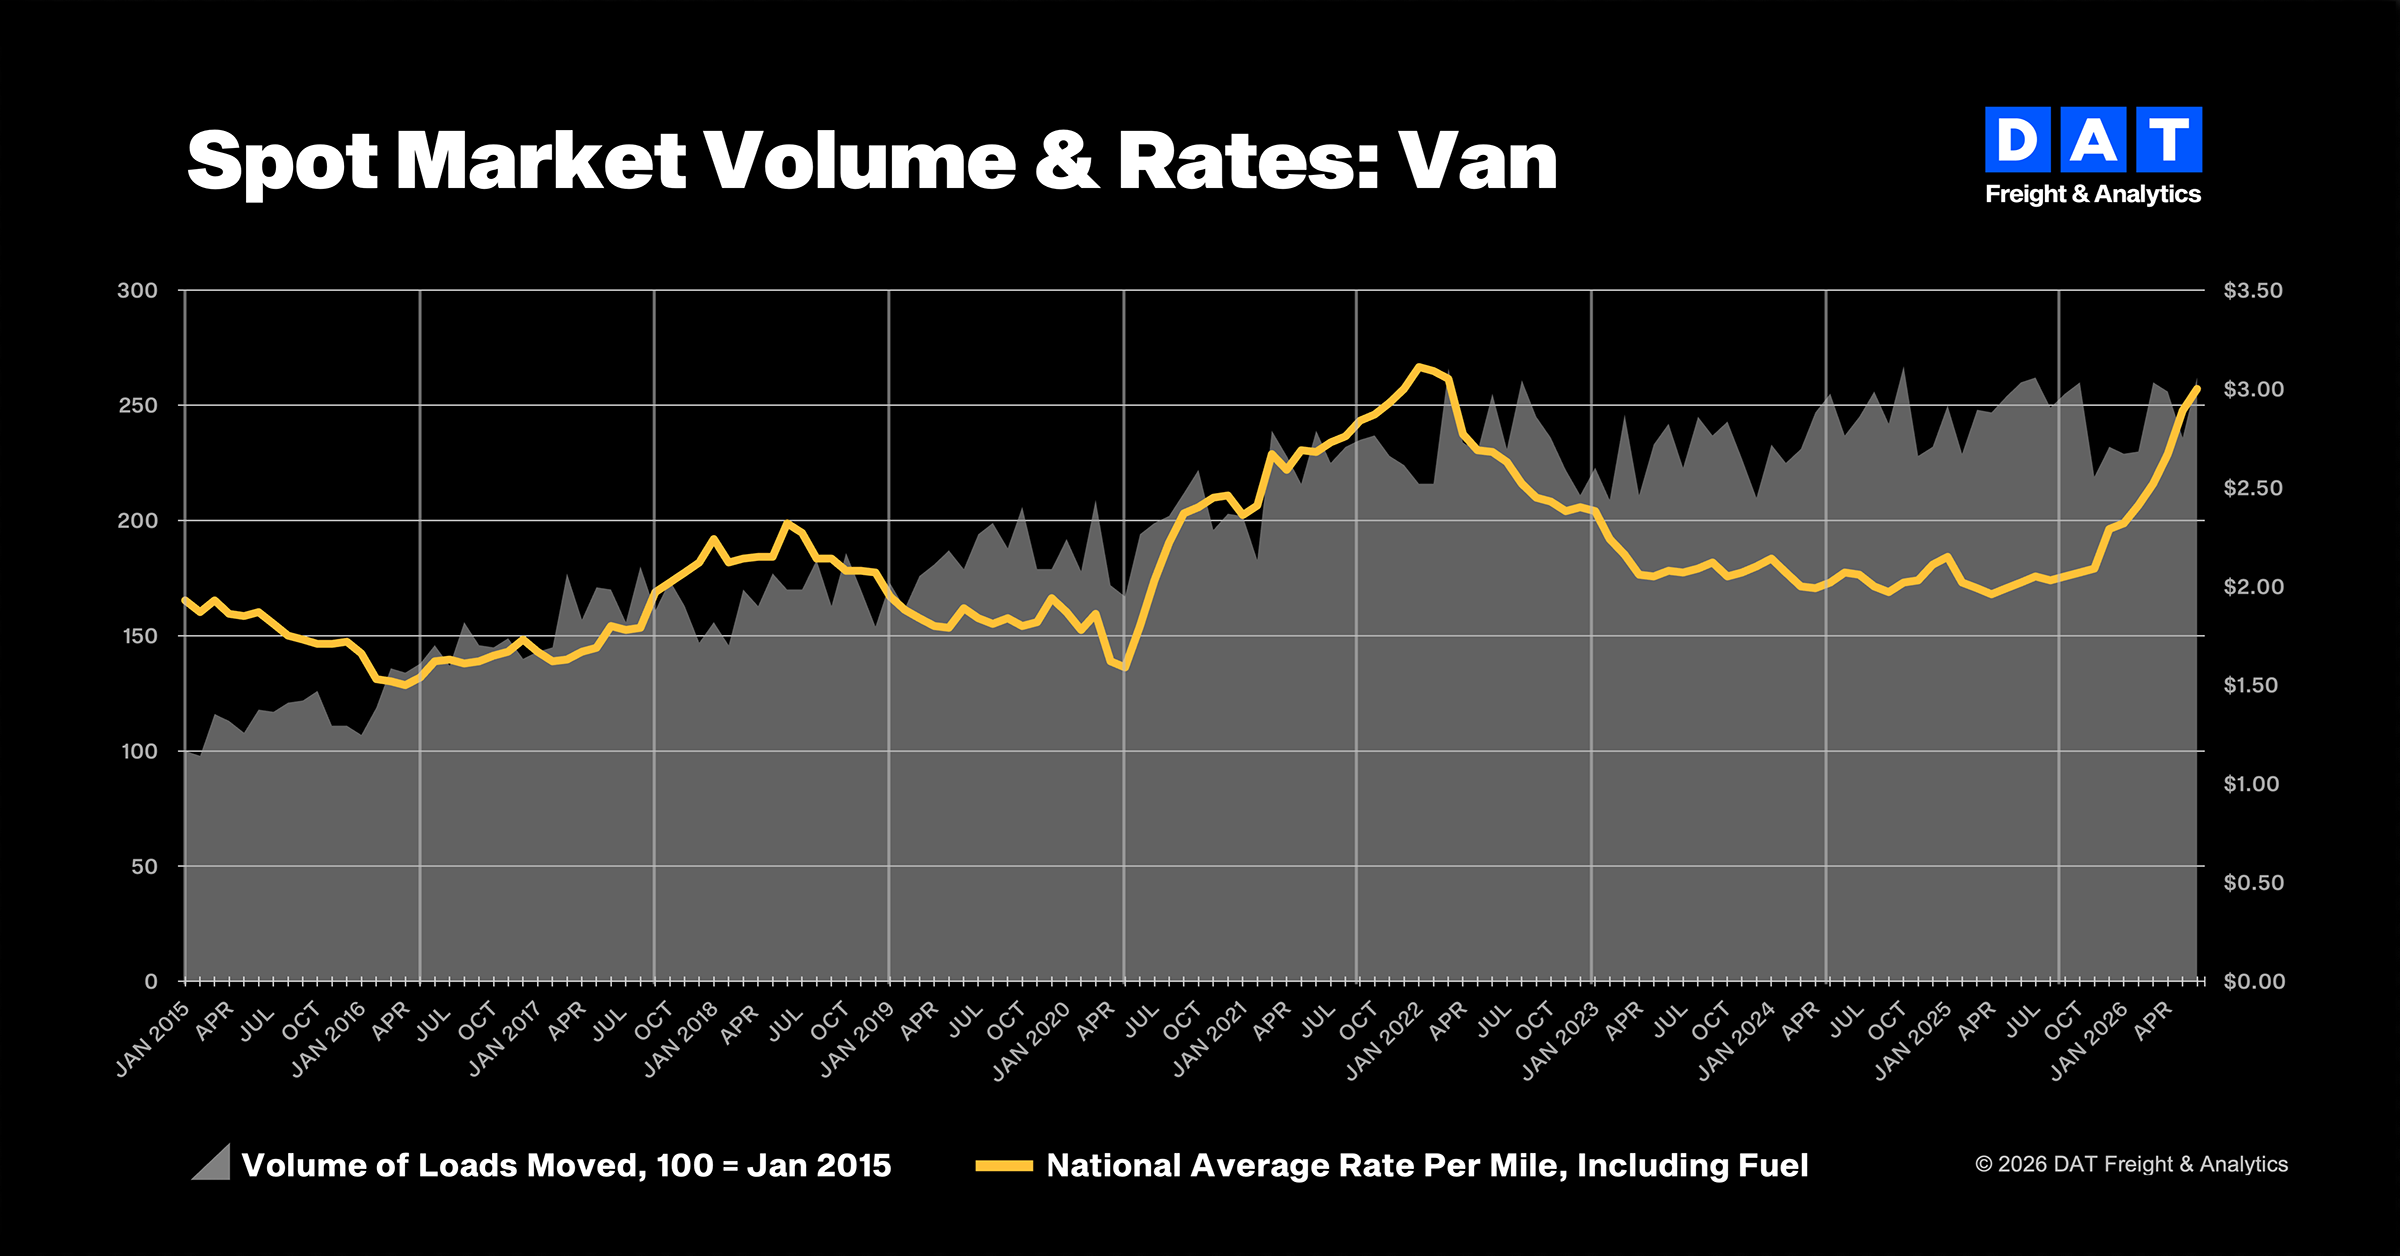
PORTLAND, Ore., July 09, 2026 (GLOBE NEWSWIRE) — Truckload rates climbed faster than freight volumes last month, a disparity that points to tighter truck capacity rather than stronger freight demand, according to DAT Freight & Analytics, provider of the industry’s leading load boards and freight analytics.
The DAT Truckload Volume Index (TVI), which measures loads moved during the month, rose across all three equipment types compared to May:
- Van TVI: 262, up 11% from May but roughly flat compared to June 2025
- Refrigerated TVI: 184, up 5% from May but down 8% from June 2025
- Flatbed TVI: 308, up 12% from May but down 4% from June 2025
The national average van truckload spot rate exceeded the contract rate in June for the first time since February 2022, and overall rate growth far exceeded volume growth last month. Spot linehaul rates increased at least 39% year over year across all three equipment types, while volumes were flat to lower. Capacity has continued to tighten amid regulatory changes and immigration enforcement, reducing the supply of qualified truck drivers.
Spot rates climb faster than volumes
Dry van, refrigerated, and flatbed spot rates all increased in June, with flatbed spot rates hitting a new all-time high. The gains came even as freight volumes rose more modestly, reinforcing signs of capacity tightening.
- Spot van rate: $3.00 per mile, up 11 cents from May
- Spot reefer rate: $3.39 per mile, up 4 cents from May
- Spot flatbed rate: $3.69 per mile, up 4 cents from May to an all-time high
Linehaul rates, which remove an amount equal to an average fuel surcharge, increased substantially:
- Van linehaul rate: $2.37 per mile, up 21 cents from May
- Reefer linehaul rate: $2.70 per mile, up 14 cents from May
- Flatbed linehaul rate: $2.94 per mile, up 16 cents from May to an all-time high
Year over year, the national average van linehaul rate was up 74 cents in June, reefer was up 76 cents, and flatbed was up 84 cents. Rates increased 45% for van freight, 39% for refrigerated, and 40% for flatbed, the largest year-over-year percentage increases in linehaul rates since June 2021 for vans and since July 2021 for reefers and flatbeds.
Contract rates lag spot
National average contract rates were mixed in June. All-in pricing slipped for van and refrigerated freight as lower fuel surcharges offset gains in linehaul rates, while flatbed edged higher:
- Contract van rate: $2.89 per mile, down 3 cents from May
- Contract reefer rate: $3.22 per mile, down 6 cents from May
- Contract flatbed rate: $3.80 per mile, up 3 cents from May
The national average contract linehaul rate increased across all three equipment types: van rose 7 cents to $2.26 per mile, reefer increased 4 cents to $2.53, and flatbed climbed 15 cents to $3.05.
Year over year, the national average contract rate was up 49 cents for van freight, 48 cents for reefer, and 71 cents for flatbed.
Spot-contract gap widens
The national average van spot rate moved above contract for the first time since February 2022, and the reefer spot-contract gap widened to 17 cents from 7 cents in May. Flatbed remains the exception, with contract linehaul rates still above spot. That spread has closed to 11 cents in June from 52 cents a year ago.
“The difference between spot and contract rates has narrowed steadily for more than a year, and carriers are gaining pricing power across the board,” said Dean Croke, DAT industry analyst. “Van spot beating contract for the first time in four years, and flatbed hitting an all-time high in the same month, shows real capacity pressure. If demand were driving this, volumes would be climbing too, and they’re not.”
About the DAT Truckload Volume Index
The DAT Truckload Volume Index measures monthly changes in loads with a pickup date during that month for hauls of 250 miles or more in the United States and Canada. A baseline of 100 equals the number of loads moved in January 2015, based on data from DAT RateView, part of the DAT iQ freight analytics platform. Rates are derived from invoice data submitted by shippers, brokers, and carriers, who provide transaction records directly from their TMS systems. Monthly average spot rates reflect amounts paid by the broker to the carrier. Contract rates are paid by shippers primarily to asset-based carriers and brokers.
About DAT Freight & Analytics
DAT Freight & Analytics operates the DAT One truckload freight marketplace; Convoy Platform, an automated freight-matching technology; DAT iQ analytics service; Trucker Tools load-visibility platform; and Outgo factoring and financial services for truckers. Shippers, transportation brokers, carriers, news organizations, and industry analysts rely on DAT for market trends and data insights, informed by nearly 700,000 daily load posts and a database exceeding $1 trillion in freight market transactions.
Founded in 1978, DAT is a business unit of Roper Technologies (Nasdaq: ROP), a constituent of the Nasdaq 100, S&P 500, and Fortune 500. Headquartered in Portland, Oregon, DAT continues to set the standard for innovation in the trucking and logistics industry. Visit dat.com for more information.
Contact:
Georgia Jablon
DAT Freight & Analytics
georgia.jablon@dat.com
904-305-6454
Stephen Petit
SiefkesPetit Communications
425-443-8976
A photo accompanying this announcement is available at https://www.globenewswire.com/NewsRoom/AttachmentNg/ce8e6700-4c43-431c-8a56-8c7cf355ee75

