Crown Castle Announces Closing of Sale of Fiber and Small Cell Businesses and Updates Full Year 2026 Outlook
HOUSTON, May 01, 2026 (GLOBE NEWSWIRE) — Crown Castle Inc. (NYSE: CCI) (“Crown Castle”) today announced the successful close of the transaction to sell its Fiber Solutions business to Zayo Group Holdings Inc. (“Zayo”) and its Small Cell business to Arium Networks, an EQT Active Core Infrastructure fund (“EQT”) company for $8.5 billion, or approximately $8.4 billion net of preliminary adjustments under the stock purchase agreement. Consistent with prior disclosures, Crown Castle expects to use a portion of the sale proceeds to repurchase $1.0 billion of shares under its stock repurchase program approved by its Board of Directors effective May 1, 2026, and reduce outstanding debt by more than $7.0 billion.
“With the completion of the transactions, Crown Castle is now the only U.S. focused, large publicly traded pure-play tower company and is well positioned to become a best-in‑class operator in the world’s strongest wireless market,” said Chris Hillabrant, Crown Castle’s President and Chief Executive Officer. “We believe this improved strategic focus enables greater customer alignment, faster decision‑making, and more disciplined execution across our high‑quality portfolio, accelerating our transformation and supporting long‑term shareholder value creation. I want to sincerely thank the teammates who supported our Fiber Solutions and Small Cell businesses for their professionalism and contributions throughout this transition and during their time at Crown Castle.”
OUTLOOK
This Outlook section contains forward-looking statements, and actual results may differ materially. Information regarding potential risks which could cause actual results to differ from the forward-looking statements herein is set forth below and in Crown Castle’s filings with the SEC.
The following table sets forth Crown Castle’s current full year 2026 Outlook, which includes a $40 million decrease in interest expense and a $10 million increase in interest income compared to the previous full year 2026 Outlook issued on April 22, 2026. These changes are a result of Fiber Solutions and Small Cell businesses sale proceeds being received on May 1, 2026, rather than June 30, 2026, as assumed in the previous Outlook.
| (in millions, except per share amounts) | Full Year 2026(a) | Changes to Midpoint from Previous Outlook(b) | |||||||||
| Site rental billings(c) | $3,800 | to | $3,830 | $— | |||||||
| Amortization of prepaid rent | 65 | to | 95 | — | |||||||
| Straight-lined revenues | (75) | to | (45) | — | |||||||
| Other revenues | 15 | to | 15 | — | |||||||
| Site rental revenues | 3,828 | to | 3,873 | — | |||||||
| Site rental costs of operations(d) | 978 | to | 1,023 | — | |||||||
| Services and other gross margin | 90 | to | 120 | — | |||||||
| Net income (loss)(e) | 690 | to | 970 | 50 | |||||||
| Net income (loss) per share—diluted(e) | 1.61 | to | 2.26 | 0.14 | |||||||
| Adjusted EBITDA(c) | 2,665 | to | 2,715 | — | |||||||
| Depreciation, amortization and accretion | 627 | to | 722 | — | |||||||
| Interest expense and amortization of deferred financing costs, net(f) | 792 | to | 837 | (40) | |||||||
| Income (loss) from discontinued operations, net of tax(g) | (360) | to | (80) | — | |||||||
| FFO(c) | 1,690 | to | 1,720 | 50 | |||||||
| AFFO(c) | 1,945 | to | 1,995 | 50 | |||||||
| AFFO per share(c) | 4.53 | to | 4.65 | 0.16 | |||||||
| Discretionary capital expenditures(c) | 150 | to | 250 | — | |||||||
| (a) | As issued on May 1, 2026. |
| (b) | As issued on April 22, 2026. |
| (c) | See “Non-GAAP Measures and Other Information” for further information and reconciliation of non-GAAP financial measures to net income (loss), including on a per share basis, and for definition of site rental billings and discretionary capital expenditures. |
| (d) | Exclusive of depreciation, amortization and accretion. |
| (e) | Includes contribution from discontinued operations. |
| (f) | See “Non-GAAP Measures and Other Information” for the reconciliation of “Outlook for Components of Interest Expense.” |
| (g) | Represents expected results from the Fiber Business, including the estimated loss on disposal. |
- The following chart reconciles the components of the expected decrease in site rental revenues from 2025 to 2026 of approximately $200 million, which remains unchanged from the previous full year 2026 Outlook.

- The chart below reconciles the components of expected growth in AFFO from 2025 to 2026 of approximately $65 million at the midpoint, which represents a $50 million increase compared to the previous full year 2026 Outlook.
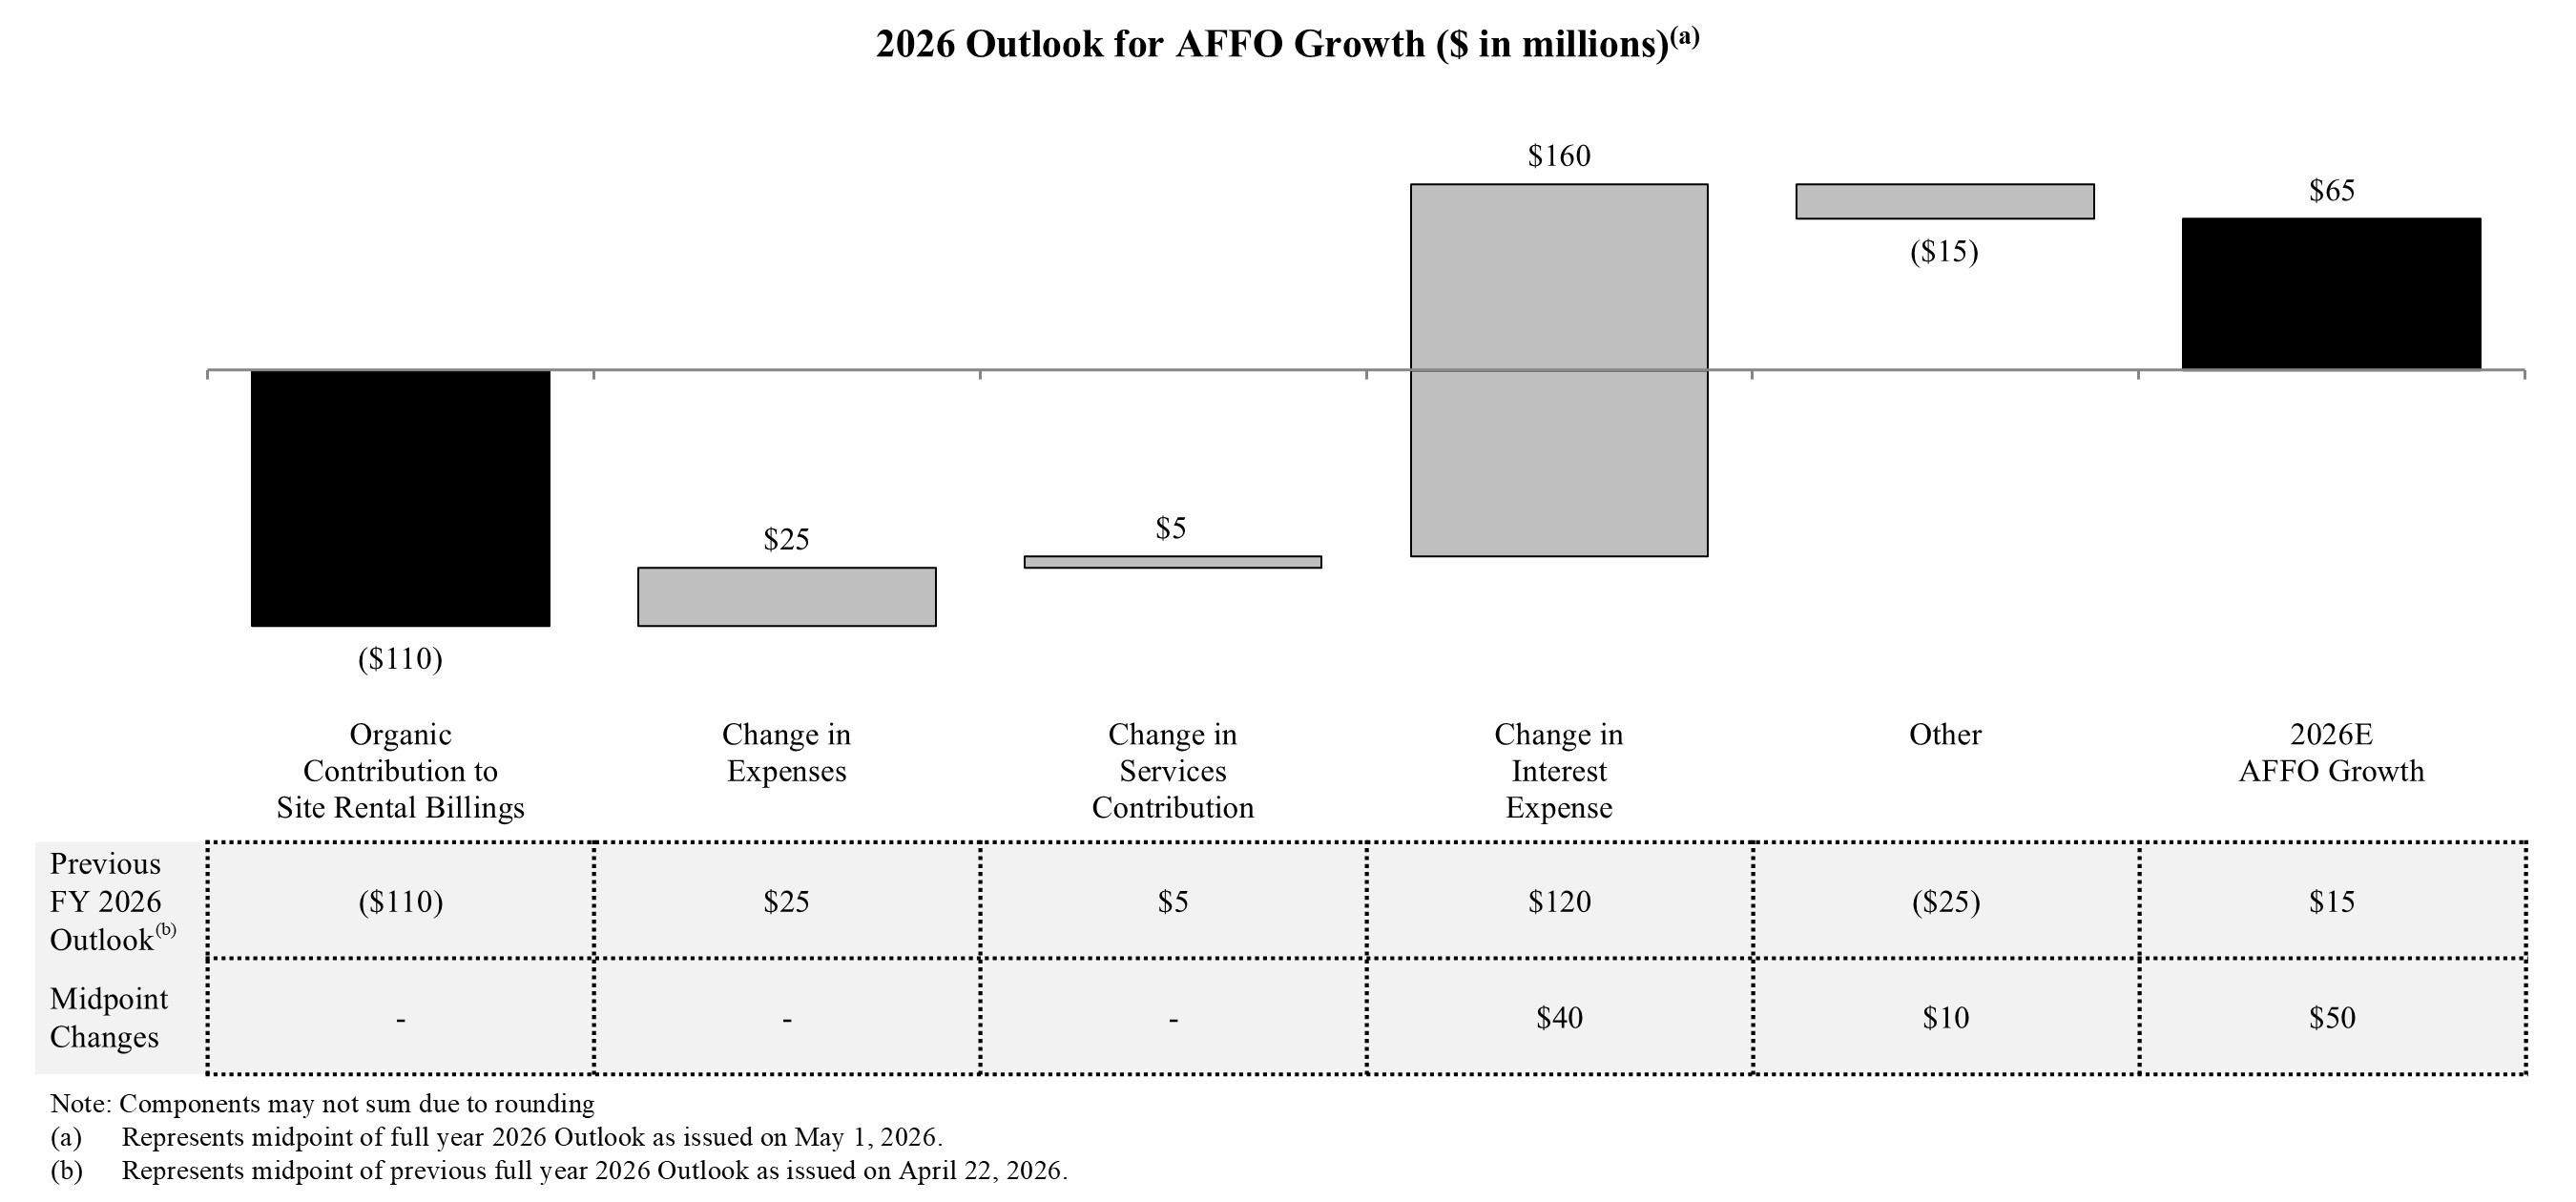
- Interest expense is expected to decrease by approximately $160 million from the repayment of more than $7 billion of outstanding debt following the closing of the Fiber Solutions and Small Cell businesses sale.
- Interest expense is expected to decrease by approximately $40 million compared to the previous full year 2026 Outlook, primarily due to the anticipated repayment of debt outstanding on the credit facility and commercial paper program occurring two months earlier than initially expected.
- Other items, which includes changes in interest income, are expected to decrease by approximately $15 million.
- Interest income is expected to increase by approximately $10 million compared to the previous full year 2026 Outlook, primarily due to an earlier investment of sale transaction proceeds reserved for the repayment of $1.75 billion of June and July 2026 debt maturities and any excess proceeds.
ABOUT CROWN CASTLE
Crown Castle owns, operates and leases approximately 40,000 cell towers across the U.S. This nationwide portfolio serves as the foundation of wireless connectivity that provides cities and communities access to essential data, technology and wireless service – bringing information, ideas, innovations and the connectivity of modern life to help people and businesses thrive. For more information on Crown Castle, please visit www.crowncastle.com.
Non-GAAP Measures and Other Information
This press release includes presentations of Adjusted EBITDA, Adjusted Funds from Operations (“AFFO”), including per share amounts, Funds from Operations (“FFO”), including per share amounts, and Organic Contribution to Site Rental Billings (including as Adjusted for Impact of Sprint Cancellations and DISH Terminations), which are non-GAAP financial measures. These non-GAAP financial measures are not intended as alternative measures of operating results or cash flow from operations (as determined in accordance with Generally Accepted Accounting Principles (“GAAP”)).
Our non-GAAP financial measures may not be comparable to similarly titled measures of other companies, including other companies in the towers sector or other real estate investment trusts (“REITs”).
In addition to the non-GAAP financial measures used herein, we also provide the components of certain GAAP measures, such as site rental revenues and capital expenditures.
Our non-GAAP financial measures are presented as additional information because management believes these measures are useful indicators of the financial performance of our business. Among other things, management believes that:
- Adjusted EBITDA is useful to investors or other interested parties in evaluating our financial performance. Adjusted EBITDA is a financial measure frequently used by management (1) to evaluate the economic productivity of our operations and (2) for purposes of making decisions about allocating resources to, and assessing the performance of, our operations. Management believes that Adjusted EBITDA helps investors or other interested parties meaningfully evaluate and compare the results of our operations (1) from period to period and (2) to our competitors, by removing the impact of our capital structure (primarily interest charges from our outstanding debt) and asset base (primarily depreciation, amortization and accretion) from our financial results. Management also believes Adjusted EBITDA is frequently used by investors or other interested parties in the evaluation of the towers sector and other REITs to measure financial performance without regard to items such as depreciation, amortization and accretion, which can vary depending upon accounting methods and the book value of assets. Adjusted EBITDA should be considered only as a supplement to net income (loss) computed in accordance with GAAP as a measure of our performance.
- AFFO, including per share amounts, is useful to investors or other interested parties in evaluating our financial performance. Management believes that AFFO helps investors or other interested parties meaningfully evaluate our financial performance as it includes (1) the impact of our capital structure (primarily interest expense on our outstanding debt and dividends on our preferred stock (in periods where applicable)) and (2) sustaining capital expenditures, and excludes the impact of our (1) asset base (primarily depreciation, amortization and accretion) and (2) certain non-cash items, including straight-lined revenues and expenses related to fixed escalations and rent free periods. GAAP requires rental revenues and expenses related to leases that contain specified rental increases over the life of the lease to be recognized evenly over the life of the lease. In accordance with GAAP, if payment terms call for fixed escalations or rent free periods, the (1) revenues are recognized on a straight-lined basis over the fixed, non-cancelable term of the tenant contract, and (2) expenses are recognized on a straight-lined basis over the estimated lease term including renewal options that are reasonably certain to be exercised. Management notes that Crown Castle uses AFFO only as a performance measure. AFFO should be considered only as a supplement to net income (loss) computed in accordance with GAAP as a measure of our performance and should not be considered as an alternative to cash flow from operations or as residual cash flow available for discretionary investment.
- FFO, including per share amounts, is useful to investors or other interested parties in evaluating our financial performance. Management believes that FFO may be used by investors or other interested parties as a basis to compare our financial performance with that of other REITs. FFO helps investors or other interested parties meaningfully evaluate financial performance by excluding the impact of our asset base (primarily real estate depreciation, amortization and accretion). FFO is not a key performance indicator used by Crown Castle. FFO should be considered only as a supplement to net income (loss) computed in accordance with GAAP as a measure of our performance and should not be considered as an alternative to cash flow from operations.
- Organic Contribution to Site Rental Billings (also referred to as organic growth) is useful to investors or other interested parties in understanding the components of the year-over-year changes in our site rental revenues computed in accordance with GAAP. Management uses Organic Contribution to Site Rental Billings to assess year-over-year growth rates for our rental activities, to evaluate current performance, to capture trends in rental rates, core leasing activities and tenant non-renewals in our core business, as well as to forecast future results. Separately, we are also disclosing Organic Contribution to Site Rental Billings as Adjusted for Sprint Cancellations and DISH Terminations, which is outside of ordinary course, to provide further insight into our results of operations and underlying trends. Management believes that identifying the impact of Sprint Cancellations and DISH Terminations provides increased transparency and comparability across periods. Organic Contribution to Site Rental Billings (including as Adjusted for Impact of Sprint Cancellations and DISH Terminations) is not meant as an alternative measure of revenue and should be considered only as a supplement in understanding and assessing the performance of our site rental revenues computed in accordance with GAAP.
Non-GAAP Financial Measures
Adjusted EBITDA. We define Adjusted EBITDA as net income (loss) plus restructuring charges (credits), asset write-down charges, goodwill impairment charges, acquisition and integration costs, depreciation, amortization and accretion, amortization of prepaid lease purchase price adjustments, interest expense and amortization of deferred financing costs, net, (gains) losses on retirement of long-term obligations, net (gain) loss on interest rate swaps, (gains) losses on foreign currency swaps, impairment of available-for-sale securities, interest income, other (income) expense, (benefit) provision for income taxes, (income) loss from discontinued operations, net of tax, cumulative effect of a change in accounting principle and stock-based compensation expense, net.
AFFO. We define AFFO as FFO before straight-lined revenues, straight-lined expenses, stock-based compensation expense, net, non-cash portion of tax provision, non-real estate related depreciation, amortization and accretion, amortization of non-cash interest expense, other (income) expense, (gains) losses on retirement of long-term obligations, net (gain) loss on interest rate swaps, (gains) losses on foreign currency swaps, impairment of available-for-sale securities, acquisition and integration costs, restructuring charges (credits), cumulative effect of a change in accounting principle and adjustments for noncontrolling interests, less sustaining capital expenditures.
AFFO per share. We define AFFO per share as AFFO divided by diluted weighted-average common shares outstanding.
FFO. We define FFO as net income (loss) plus real estate related depreciation, amortization and accretion, asset write-down charges, goodwill impairment charges, and (income) loss from discontinued operations, net of tax, less noncontrolling interest and cash paid for preferred stock dividends (in periods where applicable), and is a measure of funds from operations attributable to common stockholders.
FFO per share. We define FFO per share as FFO divided by diluted weighted-average common shares outstanding.
Organic Contribution to Site Rental Billings. We define Organic Contribution to Site Rental Billings (also referred to as organic growth) as the sum of the change in site rental revenues related to core leasing activity, escalators and other billings, including those associated with DISH Terminations, less non-renewals of tenant contracts, including those associated with Sprint Cancellations, and DISH Terminations. Additionally, Organic Contribution to Site Rental Billings as Adjusted for Impact of Sprint Cancellations and DISH Terminations reflects Organic Contribution to Site Rental Billings plus non-renewals associated with Sprint Cancellations, less Organic Contribution to Site Rental Billings associated with DISH Terminations.
Other Definitions
Site rental billings. We define site rental billings as site rental revenues exclusive of the impacts from (1) straight-lined revenues, (2) amortization of prepaid rent in accordance with GAAP, (3) contribution from recent acquisitions until the one-year anniversary of such acquisitions, (4) other revenues, such as tenant cancellation fees, finance charges and other items and (5) amounts related to DISH Terminations, where applicable.
Core leasing activity. We define core leasing activity as site rental revenues growth from tenant additions and renewals or extensions of tenant contracts, exclusive of (1) the impacts from both straight-lined revenues and amortization of prepaid rent in accordance with GAAP, (2) other revenues and (3) amounts related to DISH Terminations, where applicable.
Other billings. We define other billings as the growth or reduction in site rental revenues as a result of non-recurring contractual billings and adjustments, expense recoveries, sales credits and other amounts not captured in core leasing activity, exclusive of amounts related to DISH Terminations, where applicable.
Non-renewals. We define non-renewals of tenant contracts as the reduction in site rental revenues as a result of tenant churn, terminations and, in limited circumstances, reductions of existing lease rates, exclusive of non-renewals associated with Sprint Cancellations and DISH Terminations, where applicable.
Discretionary capital expenditures. We define discretionary capital expenditures relating to continuing operations as those made with respect to activities which we believe exhibit sufficient potential to enhance long-term stockholder value. Discretionary capital expenditures, including with respect to discontinued operations, primarily consist of expansion or development of our communications infrastructure (including capital expenditures related to (1) enhancing communications infrastructure in order to add new tenants for the first time or support subsequent tenant equipment augmentations or (2) modifying the structure of a communications infrastructure asset to accommodate additional tenants) and construction of new communications infrastructure. Discretionary capital expenditures also include purchases of land interests (which primarily relates to land assets under towers as we seek to manage our interests in the land beneath our towers), certain technology-related investments necessary to support and scale future customer demand for our communications infrastructure, and other capital projects.
Sustaining capital expenditures. We define sustaining capital expenditures as those capital expenditures (including with respect to discontinued operations) not otherwise categorized as discretionary capital expenditures, such as (1) maintenance capital expenditures on our communications infrastructure assets that enable our tenants’ ongoing quiet enjoyment of the communications infrastructure and (2) ordinary corporate capital expenditures.
Sprint Cancellations. We define Sprint Cancellations as lease cancellations related to the previously disclosed T-Mobile US, Inc. and Sprint network consolidation as described in our press release dated April 19, 2023.
DISH Terminations. We define DISH Terminations as the impact of lease terminations related to the previously disclosed notice of default and termination that was sent to DISH Wireless L.L.C. (“DISH”) regarding our Master Lease Agreement and related agreements as described in our press release dated January 12, 2026.
Fiber Business. We define Fiber Business as the historically reported Fiber segment, prior to its reclassification to discontinued operations, together with certain supporting assets and personnel. Management signed a definitive agreement (“Agreement”) to sell the Fiber Business with EQT acquiring the Small Cells business and Zayo acquiring the Fiber Solutions business (“Transaction”) for $8.5 billion in aggregate, subject to certain closing adjustments. On May 1, 2026, the Company completed the Transaction pursuant to the Agreement and received aggregate cash proceeds of $8.4 billion, representing the gross contractual purchase price of $8.5 billion less the net impact of preliminary purchase price adjustments of $124 million, which are subject to a post-closing settlement process. Through the completion of the Transaction, we continued to operate the Fiber Business in accordance with the Agreement.
| Reconciliation of Historical Adjusted EBITDA: | ||||
| For the Twelve Months Ended | ||||
| (in millions; totals may not sum due to rounding) | December 31, 2025 | |||
| Net income (loss)(a) | $ | 444 | ||
| Adjustments to increase (decrease) net income (loss): | ||||
| Asset write-down charges | 11 | |||
| Depreciation, amortization and accretion | 690 | |||
| Amortization of prepaid lease purchase price adjustments | 15 | |||
| Interest expense and amortization of deferred financing costs, net(b) | 972 | |||
| Interest income | (13 | ) | ||
| Other (income) expense | (3 | ) | ||
| (Benefit) provision for income taxes | 16 | |||
| Stock-based compensation expense, net | 73 | |||
| (Income) loss from discontinued operations, net of tax(c) | 659 | |||
| Adjusted EBITDA(d)(e) | $ | 2,863 | ||
| Reconciliation of Current Outlook for Adjusted EBITDA: | |||||||
| Full Year 2026 | |||||||
| (in millions; totals may not sum due to rounding) | Outlook(f) | ||||||
| Net income (loss)(a) | $690 | to | $970 | ||||
| Adjustments to increase (decrease) net income (loss): | |||||||
| Asset write-down charges | 10 | to | 20 | ||||
| Acquisition and integration costs | (3) | to | 3 | ||||
| Depreciation, amortization and accretion | 627 | to | 722 | ||||
| Restructuring charges | 25 | to | 35 | ||||
| Amortization of prepaid lease purchase price adjustments | 14 | to | 16 | ||||
| Interest expense and amortization of deferred financing costs, net(g) | 792 | to | 837 | ||||
| (Gains) losses on retirement of long-term obligations | — | to | — | ||||
| Interest income | (25) | to | (25) | ||||
| Other (income) expense | 0 | to | 9 | ||||
| (Benefit) provision for income taxes | 11 | to | 19 | ||||
| Stock-based compensation expense, net | 88 | to | 92 | ||||
| (Income) loss from discontinued operations, net of tax(h) | 80 | to | 360 | ||||
| Adjusted EBITDA(d)(e) | $2,665 | to | $2,715 | ||||
| (a) | Includes contribution from discontinued operations. |
| (b) | See the reconciliation of “Components of Interest Expense” for a discussion of non-cash interest expense. |
| (c) | Represents results from the Fiber Business, including a loss on disposal of $1.6 billion recorded in the full year ended December 31, 2025. |
| (d) | See discussion and our definition of Adjusted EBITDA in this “Non-GAAP Measures and Other Information.” |
| (e) | The above reconciliation excludes line items included in our definition which are not applicable for the periods shown. |
| (f) | As issued on May 1, 2026. |
| (g) | See the reconciliation of “Outlook for Components of Interest Expense” for a discussion of non-cash interest expense. |
| (h) | Represents expected results from the Fiber Business, including the estimated loss on disposal. |
| Reconciliation of Historical FFO and AFFO: | ||||||||
| For the Twelve Months Ended | ||||||||
| (in millions, except per share amounts; totals may not sum due to rounding) | December 31, 2025 | |||||||
| Net income (loss)(a) | $ | 444 | $ | 1.02 | ||||
| Real estate related depreciation, amortization and accretion | 650 | 1.49 | ||||||
| Asset write-down charges | 11 | 0.03 | ||||||
| (Income) loss from discontinued operations, net of tax(b) | 659 | 1.51 | ||||||
| FFO(c)(d) | $ | 1,764 | $ | 4.04 | ||||
| Weighted-average common shares outstanding—diluted | 437 | 437 | ||||||
| FFO (from above) | $ | 1,764 | $ | 4.04 | ||||
| Adjustments to increase (decrease) FFO: | ||||||||
| Straight-lined revenues | (12 | ) | (0.03 | ) | ||||
| Straight-lined expenses | 58 | 0.13 | ||||||
| Stock-based compensation expense, net | 73 | 0.17 | ||||||
| Non-cash portion of tax provision | 1 | — | ||||||
| Non-real estate related depreciation, amortization and accretion | 40 | 0.09 | ||||||
| Amortization of non-cash interest expense | 16 | 0.04 | ||||||
| Other (income) expense | (3 | ) | (0.01 | ) | ||||
| Sustaining capital expenditures | (33 | ) | (0.08 | ) | ||||
| AFFO(c)(d) | $ | 1,904 | $ | 4.36 | ||||
| Weighted-average common shares outstanding—diluted | 437 | 437 | ||||||
| (a) | Includes contribution from discontinued operations. |
| (b) | Represents results from the Fiber Business, including a loss on disposal of $1.6 billion recorded in the full year ended December 31, 2025. |
| (c) | See discussion and our definitions of FFO and AFFO in this “Non-GAAP Measures and Other Information.” |
| (d) | The above reconciliation excludes line items included in our definition which are not applicable for the periods shown. |
| Reconciliation of Current Outlook for FFO and AFFO: | |||||||||||||||
| Full Year 2026 | Full Year 2026 | ||||||||||||||
| (in millions, except per share amounts; totals may not sum due to rounding) | Outlook(a) | Outlook per Share(a) | |||||||||||||
| Net income (loss)(b) | $690 | to | $970 | $1.61 | to | $2.26 | |||||||||
| Real estate related depreciation, amortization and accretion | 600 | to | 680 | 1.40 | to | 1.59 | |||||||||
| Asset write-down charges | 10 | to | 20 | 0.02 | to | 0.05 | |||||||||
| (Income) loss from discontinued operations, net of tax(c) | 80 | to | 360 | 0.19 | to | 0.84 | |||||||||
| FFO(d)(e) | $1,690 | to | $1,720 | $3.94 | to | $4.01 | |||||||||
| Weighted-average common shares outstanding—diluted | 429 | 429 | |||||||||||||
| FFO (from above) | $1,690 | to | $1,720 | $3.94 | to | $4.01 | |||||||||
| Adjustments to increase (decrease) FFO: | |||||||||||||||
| Straight-lined revenues | 45 | to | 75 | 0.10 | to | 0.17 | |||||||||
| Straight-lined expenses | 45 | to | 65 | 0.10 | to | 0.15 | |||||||||
| Stock-based compensation expense, net | 88 | to | 92 | 0.21 | to | 0.21 | |||||||||
| Non-cash portion of tax provision | (8) | to | 8 | (0.02) | to | 0.02 | |||||||||
| Non-real estate related depreciation, amortization and accretion | 27 | to | 42 | 0.06 | to | 0.10 | |||||||||
| Amortization of non-cash interest expense | 15 | to | 25 | 0.03 | to | 0.06 | |||||||||
| Other (income) expense | 0 | to | 9 | 0.00 | to | 0.02 | |||||||||
| (Gains) losses on retirement of long-term obligations | — | to | — | — | to | — | |||||||||
| Acquisition and integration costs | (3) | to | 3 | (0.01) | to | 0.01 | |||||||||
| Restructuring charges | 25 | to | 35 | 0.06 | to | 0.08 | |||||||||
| Sustaining capital expenditures | (45) | to | (25) | (0.10) | to | (0.06) | |||||||||
| AFFO(d)(e) | $1,945 | to | $1,995 | $4.53 | to | $4.65 | |||||||||
| Weighted-average common shares outstanding—diluted | 429 | 429 | |||||||||||||
| (a) | As issued on May 1, 2026. |
| (b) | Includes contribution from discontinued operations. |
| (c) | Represents expected results from the Fiber Business, including the estimated loss on disposal. |
| (d) | See discussion and our definitions of FFO and AFFO, including per share amounts, in this “Non-GAAP Measures and Other Information.” |
| (e) | The above reconciliation excludes line items included in our definition which are not applicable for the period shown. |
| For Comparative Purposes – Reconciliation of Previous Outlook for Adjusted EBITDA: | |||||||
| Previously Issued | |||||||
| (in millions; totals may not sum due to rounding) | Full Year 2026 Outlook(a) | ||||||
| Net income (loss)(b) | $640 | to | $920 | ||||
| Adjustments to increase (decrease) net income (loss): | |||||||
| Asset write-down charges | 10 | to | 20 | ||||
| Acquisition and integration costs | (3) | to | 3 | ||||
| Depreciation, amortization and accretion | 627 | to | 722 | ||||
| Restructuring charges | 25 | to | 35 | ||||
| Amortization of prepaid lease purchase price adjustments | 14 | to | 16 | ||||
| Interest expense and amortization of deferred financing costs, net(c) | 832 | to | 877 | ||||
| (Gains) losses on retirement of long-term obligations | — | to | — | ||||
| Interest income | (15) | to | (15) | ||||
| Other (income) expense | 0 | to | 9 | ||||
| (Benefit) provision for income taxes | 11 | to | 19 | ||||
| Stock-based compensation expense, net | 88 | to | 92 | ||||
| (Income) loss from discontinued operations, net of tax(d) | 80 | to | 360 | ||||
| Adjusted EBITDA(e)(f) | $2,665 | to | $2,715 | ||||
| For Comparative Purposes – Reconciliation of Previous Outlook for FFO and AFFO: | |||||||||||||||
| (in millions, except per share amounts; totals may not sum due to rounding) | Previously Issued Full Year 2026 Outlook(a) | Previously Issued Full Year 2026 Outlook per share(a) | |||||||||||||
| Net income (loss)(b) | $640 | to | $920 | $1.48 | to | $2.12 | |||||||||
| Real estate related depreciation, amortization and accretion | 600 | to | 680 | 1.39 | to | 1.57 | |||||||||
| Asset write-down charges | 10 | to | 20 | 0.02 | to | 0.05 | |||||||||
| (Income) loss from discontinued operations, net of tax(d) | 80 | to | 360 | 0.18 | to | 0.83 | |||||||||
| FFO(e)(f) | $1,640 | to | $1,670 | $3.79 | to | $3.86 | |||||||||
| Weighted-average common shares outstanding—diluted | 433 | 433 | |||||||||||||
| FFO (from above) | $1,640 | to | $1,670 | $3.79 | to | $3.86 | |||||||||
| Adjustments to increase (decrease) FFO: | |||||||||||||||
| Straight-lined revenues | 45 | to | 75 | 0.10 | to | 0.17 | |||||||||
| Straight-lined expenses | 45 | to | 65 | 0.10 | to | 0.15 | |||||||||
| Stock-based compensation expense, net | 88 | to | 92 | 0.20 | to | 0.21 | |||||||||
| Non-cash portion of tax provision | (8) | to | 8 | (0.02) | to | 0.02 | |||||||||
| Non-real estate related depreciation, amortization and accretion | 27 | to | 42 | 0.06 | to | 0.10 | |||||||||
| Amortization of non-cash interest expense | 15 | to | 25 | 0.03 | to | 0.06 | |||||||||
| Other (income) expense | 0 | to | 9 | 0.00 | to | 0.02 | |||||||||
| (Gains) losses on retirement of long-term obligations | — | to | — | — | to | — | |||||||||
| Acquisition and integration costs | (3) | to | 3 | (0.01) | to | 0.01 | |||||||||
| Restructuring charges | 25 | to | 35 | 0.06 | to | 0.08 | |||||||||
| Sustaining capital expenditures | (45) | to | (25) | (0.10) | to | (0.06) | |||||||||
| AFFO(e)(f) | $1,895 | to | $1,945 | $4.38 | to | $4.49 | |||||||||
| Weighted-average common shares outstanding—diluted | 433 | 433 | |||||||||||||
| (a) | As issued on April 22, 2026. |
| (b) | Includes contribution from discontinued operations. |
| (c) | See the reconciliation of “Outlook for Components of Interest Expense” for a discussion of non-cash interest expense. |
| (d) | Represents expected results from the Fiber Business, including the estimated loss on disposal. |
| (e) | See discussion of and our definition of Adjusted EBITDA, FFO and AFFO, including per share amounts in this “Non-GAAP Measures and Other Information.“ |
| (f) | The above reconciliation excludes line items included in our definition which are not applicable for the period shown. |
| Components of Changes in Site Rental Revenues for Current Outlook for Full Year 2026: | |||||||
| (dollars in millions; totals may not sum due to rounding) | Full Year 2026 Outlook(a)(b) | ||||||
| Components of changes in site rental revenues: | |||||||
| Prior year site rental billings excluding site rental billings to DISH(c) | $3,701 | ||||||
| Prior year site rental billings to DISH(c) | 222 | ||||||
| Prior year site rental billings(c) | $3,923 | ||||||
| Core leasing activity(c) | 60 | to | 70 | ||||
| Escalators | 95 | to | 105 | ||||
| Non-renewals(c) | (35) | to | (25) | ||||
| Other billings(c) | (5) | to | (5) | ||||
| Organic Contribution to Site Rental Billings as Adjusted for Impact of Sprint Cancellations and DISH Terminations(c) | 115 | to | 145 | ||||
| Non-renewals associated with Sprint Cancellations(c) | (20) | to | (20) | ||||
| Non-renewals associated with DISH Terminations(c) | (220) | to | (220) | ||||
| Organic Contribution to Site Rental Billings(c) | (125) | to | (95) | ||||
| Straight-lined revenues | (75) | to | (45) | ||||
| Amortization of prepaid rent | 65 | to | 95 | ||||
| Other revenues | 15 | to | 15 | ||||
| Acquisitions(d) | — | ||||||
| Total site rental revenues | $3,828 | to | $3,873 | ||||
| Year-over-year changes in revenues:(e) | |||||||
| Site rental revenues as a percentage of prior year site rental revenues | (4.9)% | ||||||
| Organic Contribution to Site Rental Billings as Adjusted for Impact of Sprint Cancellations and DISH Terminations as a percentage of prior year site rental billings excluding site rental billings to DISH(c) | 3.5% | ||||||
| Organic Contribution to Site Rental Billings as Adjusted for Impact of Sprint Cancellations and DISH Terminations as a percentage of prior year site rental billings(c) | 3.3% | ||||||
| Organic Contribution to Site Rental Billings as a percentage of prior year site rental billings(c) | (2.8)% | ||||||
| (a) | As issued on May 1, 2026, and unchanged from previous full year Outlook issued on April 22, 2026. |
| (b) | Represents full year 2026 Outlook for continuing operations only. |
| (c) | See our definitions of site rental billings, core leasing activity, non-renewals, other billings, Sprint Cancellations, DISH Terminations, Organic Contribution to Site Rental Billings, and Organic Contribution to Site Rental Billings as Adjusted for Impact of Sprint Cancellations and DISH Terminations in this “Non-GAAP Measures and Other Information.“ |
| (d) | Represents the contribution from recent acquisitions. The financial impact of recent acquisitions is excluded from Organic Contribution to Site Rental Billings, including as Adjusted for Impact of Sprint Cancellations and DISH Terminations, until the one-year anniversary of such acquisitions. |
| (e) | Calculated based on midpoint of full year 2026 Outlook, where applicable. |
| Components of Capital Expenditures:(a)(b) | ||
| For the Twelve Months Ended | ||
| (in millions) | December 31, 2025 | |
| Discretionary capital expenditures: | ||
| Tower improvements and other capital projects | $ | 72 |
| Purchases of land interests | 77 | |
| Sustaining capital expenditures | 33 | |
| Total capital expenditures | $ | 182 |
| Outlook for Discretionary Capital Expenditures Less Prepaid Rent Additions:(b)(c) | |||||||
| (in millions) | Full Year 2026 Outlook(d) | ||||||
| Discretionary capital expenditures | $150 | to | $250 | ||||
| Less: Prepaid rent additions(e) | (30) | to | (50) | ||||
| Discretionary capital expenditures less prepaid rent additions | $110 | to | $210 | ||||
| Components of Interest Expense: | |||
| For the Twelve Months Ended | |||
| (in millions) | December 31, 2025 | ||
| Interest expense on debt obligations | $ | 956 | |
| Amortization of deferred financing costs and adjustments on long-term debt | 31 | ||
| Capitalized interest | (15 | ) | |
| Interest expense and amortization of deferred financing costs, net | $ | 972 | |
| Outlook for Components of Interest Expense: | |||||||||||||||
| (in millions) | Full Year 2026 Outlook(f) | Previous Full Year 2026 Outlook(g) | |||||||||||||
| Interest expense on debt obligations | $775 | to | $815 | $815 | to | $855 | |||||||||
| Amortization of deferred financing costs and adjustments on long-term debt | 25 | to | 35 | 25 | to | 35 | |||||||||
| Capitalized interest | (15) | to | (5) | (15) | to | (5) | |||||||||
| Interest expense and amortization of deferred financing costs, net | $792 | to | $837 | $832 | to | $877 | |||||||||
| (a) | See our definitions of discretionary capital expenditures and sustaining capital expenditures in this “Non-GAAP Measures and Other Information.“ |
| (b) | The financial impact of the Fiber Business is excluded as these amounts are presented within discontinued operations. |
| (c) | Excludes sustaining capital expenditures. See “Non-GAAP Measures and Other Information” for our definitions of discretionary capital expenditures and sustaining capital expenditures. |
| (d) | As issued on May 1, 2026, and unchanged from previous full year 2026 Outlook issued on April 22, 2026. |
| (e) | Reflects up-front consideration from long-term tenant contracts (commonly referred to as prepaid rent) that are amortized and recognized as revenue over the associated estimated lease term in accordance with GAAP. |
| (f) | As issued on May 1, 2026. |
| (g) | As issued on April 22, 2026. |
Cautionary Language Regarding Forward-Looking Statements
This news release contains forward-looking statements and information that are based on our management’s current expectations as of the date of this news release. Statements that are not historical facts are hereby identified as forward-looking statements. In addition, words such as “estimate,” “see,” “anticipate,” “project,” “plan,” “intend,” “believe,” “expect,” “likely,” “predicted,” “positioned,” “continue,” “target,” “focus,” and any variations of these words and similar expressions are intended to identify forward-looking statements. Such statements include our full year 2026 Outlook and plans, projections, expectations and estimates regarding (1) the value of our business model and strategy, (2) creation and maximization of shareholder value and returns, (3) potential benefits from operating as a pure-play, U.S.-focused tower company, (4) results from the Fiber Business, (5) net income (loss) (including on a per share basis), (6) AFFO (including on a per share basis) and its components and growth, (7) Adjusted EBITDA and its components and growth, (8) Organic Contribution to Site Rental Billings (including as Adjusted for Impact of Sprint Cancellations and DISH Terminations) and its components and growth, (9) site rental revenues and its components and growth, (10) the Fiber Business sale, including use of proceeds therefrom and timing of such proceeds, (11) interest expense, (12) dividends, including dividend levels, rates and amounts, (13) repayment or repurchase of outstanding debt, including timing and amounts and (14) share repurchases under our Stock Repurchase Program, including share repurchase levels and amounts. Any dividends remain subject to the approval of our Board of Directors which has the discretion to determine whether to declare dividends and the amounts and timing of the dividends.
Such forward-looking statements are subject to certain risks, uncertainties and assumptions and should be considered in light of the risks referenced in the “Risk Factors” section included in our most recent Annual Report on Form 10-K and Quarterly Reports on Form 10-Q. Such factors include, but are not limited to:
- prevailing market conditions;
- a slowdown in demand for our towers and a reduction in the amount or change in the mix of network investment by our tenants;
- the loss, consolidation or financial instability of any of our tenants;
- expansion or development of our business and the potential disruptions in our business caused thereby;
- failure to timely, efficiently and safely execute on our construction projects;
- reduction in demand for our towers as a result of new technologies;
- failure to retain rights to our towers;
- volatility in demand in our services business, which may reduce the predictability of our results;
- inability to negotiate favorable rates on our new or renewing tenant contracts as a result of competition in our industry;
- delayed timing or lack of deployment or adoption by tenants of new wireless technologies;
- the impact of cybersecurity breaches or other information technology disruptions;
- the impact of climate-related events, natural disasters, including wildfires, and other unforeseen events on our business;
- failure to attract, recruit and retain qualified and experienced employees;
- changes to management, including turnover of our top executives;
- actions and plans related to restructuring our business;
- the sale of our Fiber Business to EQT and Zayo;
- availability of financing and capital, the levels of debt that we maintain, the terms of our debt instruments, compliance with debt covenants and our credit ratings;
- the impact on the market price of our common stock as a result of sales or issuances of a substantial number of shares of our common stock;
- the introduction of new laws or regulations or failure to comply with laws or regulations which regulate our business;
- funding of future dividend payments to our stockholders; and
- failure to maintain our REIT status for U.S. federal income tax purposes.
The Company discusses these and other risks and uncertainties under the heading “Risk Factors” in its annual and quarterly periodic reports filed with the SEC. The Company may update that discussion in subsequent other periodic reports, but except as required by law, the Company undertakes no duty or obligation to update or revise these forward-looking statements, whether as a result of new information, future developments, or otherwise. Should one or more of these or other risks or uncertainties materialize, or should underlying assumptions prove incorrect, actual results may vary materially from those expected.
As used in this release, the term “including,” and any variation thereof, means “including without limitation.”
| Contacts: | Sunit Patel, CFO |
| Kris Hinson, VP Corp Finance & Treasurer | |
| Crown Castle Inc. | |
| 713-570-3050 |
Photos accompanying this announcement are available at:
https://www.globenewswire.com/NewsRoom/AttachmentNg/4501d0f3-42b7-43c3-a928-65e87db60978
https://www.globenewswire.com/NewsRoom/AttachmentNg/d636bfc1-8bef-4f74-a2e4-cfa1c8c51d5b
![]()
