Bonterra Energy Announces Charlie Lake Well Results, Strategic Charlie Lake Acquisition and 2026 Preliminary Budget Guidance
CALGARY, Alberta, Dec. 15, 2025 (GLOBE NEWSWIRE) — Bonterra Energy Corp. (TSX: BNE) (“Bonterra” or the “Company”) is pleased to announce its latest Charlie Lake well results, a strategic Charlie Lake acquisition and its 2026 preliminary budget guidance.
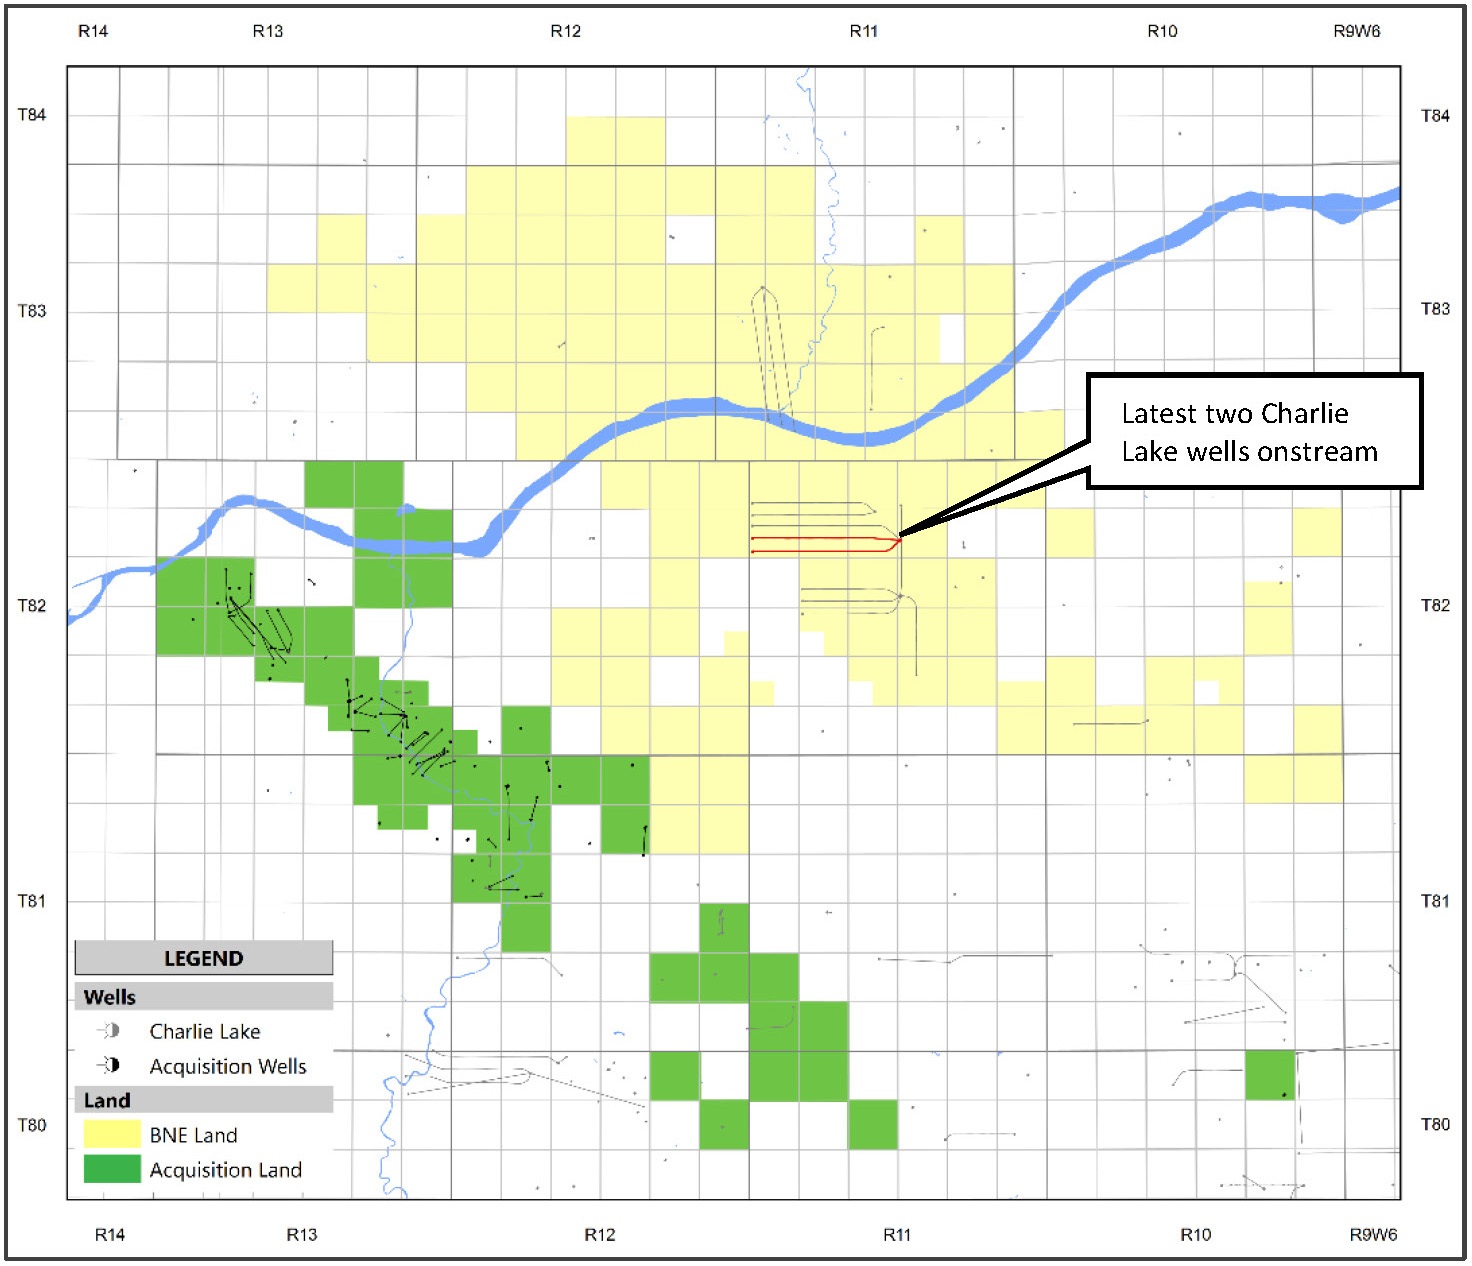
- LATEST TWO CHARLIE LAKE WELLS ONSTREAM IN Q4 2025 WITH AVERAGE 30-DAY SINGLE WELL PEAK RATES OF APPROXIMATELY 1,325 BOE PER DAY
- ENTERED INTO A DEFINITIVE AGREEMENT TO EXPAND CORE AREA POSITION IN THE CHARLIE LAKE THROUGH A PROPERTY ACQUISITION ADJACENT TO EXISTING OPERATIONS ADDING APPROXIMATELY 760 BOE/D OF PRODUCTION AND 21 TOP TIER DRILLING LOCATIONS
- PRELIMINARY 2026 BUDGET GUIDANCE OF 16,200 TO 16,400 BOE PER DAY SUPPORTED BY $75 TO $80 MILLION CAPITAL PROGRAM
CHARLIE LAKE WELL RESULTS
The Company has finished completion operations on its latest two gross (1.8 net) wells in the fourth quarter of 2025. These wells were executed with three-mile laterals and increased fracture stimulation intensity as compared to the Company’s previously drilled Charlie Lake wells and are showing encouraging early-stage results averaging 30-day peak rates at a combined 2,650 BOE per day, including approximately 1,100 barrels per day of light crude oil, 100 barrels per day of natural gas liquids and 8.7 mmcf per day of conventional natural gas. The Company has an additional well (0.9 net) drilled from the same surface location which is planned to be completed and brought on production in the first quarter of 2026.
Bonterra’s execution and results to date in the Charlie Lake play have solidified its intention to continue increasing size and scale as an operator in the play moving forward.
EXPANSION OF CHARLIE LAKE CORE AREA THROUGH STRATEGIC ACQUISITION
The Company is pleased to announce that it has entered into a definitive agreement with a private company to acquire an asset adjacent to its existing Charlie Lake operations in the Greater Bonanza Area for total cash consideration of $15.7 million, subject to customary closing adjustments (the “Acquisition”). The Acquisition is immediately accretive to production, cash flow and free cash flow per share.
Acquisition Highlights:
- Low decline base production: Approximately 760 BOE per day1 of existing production in low decline oil pools under waterflood;
- Increased area footprint: 41 net sections of land in the Greater Bonanza Area offsetting existing Charlie Lake operations;
- Charlie Lake drilling inventory: 21 identified top tier drilling locations complementary to its existing Charlie Lake inventory in addition to 3 low risk infill locations in the Doig formation; and
- Synergistic infrastructure: Strategic owned and operated infrastructure footprint of underutilized compression, batteries and gathering pipelines creates immediate half cycle drilling opportunities on the acquired lands and proximal existing lands and offers new gas processing optionality in the Greater Bonanza Area.
1 Volumes are comprised of approximately 240 bbl/d light and medium crude oil, 40 bbl/d NGLs and 2,885 mcf/d of conventional natural gas.
The acquisition increases the Company’s Greater Bonanza Charlie Lake Area (map below) land holdings by 36% and strengthens its footprint in its Charlie Lake core area at Bonanza. “Coming off the two most productive wells in Bonterra’s history, this transaction complements our existing operations and adds meaningful depth and quality of drilling inventory to Bonterra’s Charlie Lake asset”, said Patrick Oliver, President and CEO, “Accretive acquisitions in our core areas have been a focus of our team and we are pleased to expand our Charlie Lake inventory position through this strategic transaction and look forward to deploying drilling capital on the acquired assets in 2026.”
Bonterra plans to drill two gross Charlie Lake locations utilizing a combination of acquired infrastructure and lands from the Acquisition in 2026.
Upon closing, the Company has commitments in place from its banking syndicate to increase its revolving credit facility borrowing base capacity from $125 to $150 million which will increase liquidity post-closing. The transaction will be funded through the revolving credit facility and is expected to close before December 31, 2025.
Greater Bonanza Area
PRELIMINARY 2026 BUDGET: DELIVERING 8% YOY PRODUCTION GROWTH1,2 AND 14% FREE FUNDS FLOW YIELD4,5
Following a strong year in 2025 where the Company executed a pivotal capital raise through the Canadian high yield bond market in the refinancing of its balance sheet, demonstrated strong operational performance through positive guidance revisions on both production and capital, and increased its presence in the Charlie Lake and Montney plays, the Company’s Board of Directors (the “Board”) has approved its 2026 preliminary budget (the “Budget”) along with the associated guidance outlined below:
- Approved capital expenditure range of $75 to $80 million;
- Annual average production of 16,200 and 16,400 BOE per day2, weighted approximately 50 to 52 percent to oil and liquids;
- Funds Flow5 expected between $105 million to $110 million ($2.87 per share3 to $3.00 per share3);
- Free Funds Flow5 of approximately $21 million ($0.55 per share3) generating approximately 14% Free Funds Flow Yield4,5 anchored on US$60 per barrel WTI and $3.00 per GJ AECO;
- $8 million allocated to abandonment and reclamation obligations (“ARO”) in 2026; and
- Net Debt to Last Twelve Months’ EBITDA ratio5 expected to be approximately 1.3x at year end 2026.
______________________________________
1 Based on 2025 guidance midpoint of 15,100 BOE per day and 2026 guidance midpoint of 16,300 BOE per day.
2 2026 annual average volumes are anticipated to be comprised of approximately 6,650 bbl/d light and medium crude oil, 1,575 bbl/d NGLs and 48,500 mcf/d of conventional natural gas based on a midpoint of 16,300 BOE per day (inclusive of the Acquisition).
3 Based on annualized basic weighted average shares outstanding of 36,574,980.
4 Based on the closing price of the Company’s Common Shares on the TSX on December 12, 2025 of $4.15 per share.
5 Non-IFRS Measure. See “Cautionary Statements” below.
BUDGET AND GUIDANCE DETAILS
The 2026 Budget is structured to generate meaningful Free Funds Flow through further investment in the development and delineation of its Charlie Lake and Montney assets, and continuing to optimize the Company’s Cardium asset through targeted waterflood projects and development drilling. The Company remains committed to a disciplined approach to managing leverage levels and will focus use of Free Funds Flow to debt repayment and share buybacks in 2026.
The allocation of the Company’s 2026 planned capital expenditures is expected to be:
- approximately 60 percent towards the Charlie Lake core area, directed to the completion activities of 1 gross (0.9 net) drilled and uncompleted (DUC) well carried over from the 2025 capital program, the drilling and completion activities of 6 gross (5.7 net) wells and infrastructure projects to support the area’s long term development;
- approximately 10 percent towards the Montney, directed to the completion of 1 gross (1 net) drilled and uncompleted (DUC) well carried over from the 2025 capital program;
- approximately 25 percent towards the Cardium core area, directed to waterflood projects and development drilling and completions activities; and
- approximately 5 percent to land and facilities maintenance.
To mitigate risk and add stability during periods of market volatility, hedges have been put in place on approximately 31 percent of Bonterra’s expected crude oil and 21 percent of its natural gas production, both net of royalties, through the first half of 2026. Through the next six months, Bonterra has secured WTI prices between $55.00 USD to $72.50 USD per bbl on approximately 1,750 bbls per day; and natural gas prices between $1.75 to $3.30 per GJ on approximately 10,750 GJ per day. In addition, Bonterra has secured WTI pricing of $60.04 USD per barrel for 500 barrels per day for the final six months of 2026, and natural gas prices between $3.10 and $3.30 per GJ for 6,679 GJ per day covering the final six months of 2026 and the first quarter of 2027, through fixed-price contracts.
Bonterra’s budget is designed to enable the Company to responsibly manage the pace of capital deployment and prioritize the best return projects in allocating capital. Bonterra plans to regularly review the Budget and may elect to adjust the amount and timing of capital spending depending on the prevailing commodity price environment.
2026 Guidance Summary and Sensitivities
| 2026 Guidance | ||
| Pricing | ||
| WTI ($US per bbl) | $60.00 | |
| AECO Natural Gas Prices ($ per GJ) | $3.00 | |
| Canadian $ to U.S. $ exchange rate | $0.72 | |
| Canadian Realized Oil Price ($ per bbl)1 | $74.65 | |
| Canadian Realized Average Price ($ per BOE) | $45.51 | |
| Operating & Financial | ||
| Average Daily Production (BOE per day) | 16,200 – 16,400 | |
| Oil and NGL Weighting (percent) | 50 – 52 | |
| Funds Flow2 (millions) | $105 –110 | |
| Capital Expenditures (millions) | $75 – 80 | |
| Free Funds Flow (millions) | $21 | |
| Asset Retirement Obligations (millions) | $8 | |
| Net Debt to Last Twelve Months’ EBITDA1 | 1.3x | |
Notes:
1 Canadian realized oil price is based on WTI US $60 per barrel; Edmonton par differential of US $3.50 per barrel; CAD/USD exchange rate of $1.39 and a quality adjustment of CAD $3.85 per barrel. Pricing includes hedges currently in place.
2 Funds Flow is estimated using the Canadian realized oil price above, a realized natural gas price of CAD $3.70 per mcf; and a realized NGL price of CAD $42.00 per barrel. Pricing includes hedges currently in place.
The following table shows Bonterra’s sensitivity to key commodity price variables. The sensitivity calculations are performed independently and show the effect of changing one variable while holding all other variables constant.
Annualized sensitivity analysis on funds flow, as estimated for 20261
| Impact on funds flow | Change | $MM | $ per share2 |
| WTI crude oil price (US$/bbl) | $1.00 | $2.18 | $0.06 |
| AECO natural gas price ($/GJ) | $0.10 | $1.48 | $0.04 |
| U.S.$ to Canadian $ exchange rate | $0.01 | $1.02 | $0.03 |
Notes:
1 This analysis uses current royalty rates, annualized estimated average production of 16,300 BOE per day and no changes in working capital.
2 Based on annualized basic weighted average shares outstanding of 36,574,980.
ABOUT BONTERRA
Bonterra Energy Corp. is a conventional oil and gas corporation forging a grounded path forward for Canadian energy. Operations include a large, concentrated land position in Alberta’s Pembina Cardium, one of Canada’s largest oil plays. Bonterra’s liquids-weighted Cardium production provides a foundation for implementing a return of capital strategy over time, which is focused on generating long-term, sustainable growth and value creation for shareholders. Emerging Charlie Lake and Montney resource plays are expected to provide enhanced optionality and an expanded potential development runway for the future. Our shares are listed on the Toronto Stock Exchange under the symbol “BNE” and we invite stakeholders to follow us on LinkedIn and X (formerly Twitter) for ongoing updates and developments.
For further information please contact:
Patrick Oliver, President & CEO
Scott Johnston, CFO
Telephone: (403) 262-5307
Fax: (403) 265-7488
Email: ir@bonterraenergy.com
Use of Non-IFRS Financial Measures
In this release, the Company refers to certain financial measures to analyze operating performance, which are not standardized measures recognized under IFRS and do not have a standardized meaning prescribed by IFRS. These measures are commonly utilized in the oil and gas industry and are considered informative by management, shareholders and analysts. These measures may differ from those made by other companies and accordingly may not be comparable to such measures as reported by other companies. In addition, this release contains the terms “funds flow”, “capital expenditures”, “free funds flow”, “free funds flow yield”, “net debt” and “net debt to EBITDA ratio” to analyze operating performance. Non-IFRS and other financial measures within this release may refer to forward-looking Non-IFRS and other financial measures and are calculated consistently with the three and nine months ended September 30, 2025 reconciliations as outlined below.
Funds Flow
Funds flow is a non-IFRS financial measure, calculated as cash flow from operating activities including proceeds from sale of investments and investment income received excluding effects of changes in non-cash working capital items and decommissioning expenditures settled. Management uses funds flow to determine the cash generated during a period.
The following is a reconciliation of funds flow to the most directly comparable IFRS measure, cash flow from operating activities:
| Three months ended | Nine months ended | ||||||||
| ($ millions) | September 30, 2025 | September 30, 2024 | September 30, 2025 | September 30, 2024 | |||||
| Cash flow from operating activities | 8.3 | 31.5 | 68.0 | 86.3 | |||||
| Adjusted for: | |||||||||
| Changes in non-cash working capital | 6.1 | (2.6 | ) | 0.7 | (3.1 | ) | |||
| Interest expense | (4.1 | ) | (4.4 | ) | (12.6 | ) | (13.5 | ) | |
| Interest paid | 7.7 | 3.1 | 10.2 | 12.2 | |||||
| Decommissioning expenditures | 3.2 | 2.4 | 5.5 | 5.0 | |||||
| Investment income received | 0.1 | 0.1 | 0.3 | 0.3 | |||||
| Proceeds on sale of investments | – | – | – | 1.4 | |||||
| Funds flow | 21.3 | 30.1 | 72.1 | 88.6 | |||||
Capital Expenditures
Capital expenditures are a non-IFRS financial measure. They are calculated as the sum of exploration and evaluation costs and property, plant, and equipment costs per the statement of cash flow. Management uses this metric to assess the total cash capital expenditures incurred during the period as follows:
| Three months ended | Nine months ended | ||||
| September 30, 2025 | September 30, 2024 | September 30, 2025 | September 30, 2024 | ||
| ($ millions) | |||||
| Comprised of: | |||||
| Exploration and evaluation expenditures | 0.4 | 0.2 | 0.8 | 0.9 | |
| Property, plant and equipment expenditures | 14.4 | 23.9 | 52.8 | 77.7 | |
| Capital Expenditures | 14.8 | 24.1 | 53.6 | 78.6 | |
Free Funds Flow
Management utilizes free funds flow to assess the amount of funds available for future capital allocation decisions. It is calculated as funds flow less capital expenditures, acquisitions net of proceeds on sale of property and decommissioning expenditures settled.
| Free Funds Flow | |||||||||
| Three months ended | Nine months ended | ||||||||
| ($ millions) | September 30, 2025 | September 30, 2024 | September 30, 2025 | September 30, 2024 | |||||
| Funds flow | 21.3 | 30.1 | 72.1 | 88.6 | |||||
| Adjusted for: | |||||||||
| Capital expenditures | (14.8 | ) | (24.1 | ) | (53.6 | ) | (78.6 | ) | |
| Acquisition | – | – | – | (23.6 | ) | ||||
| Proceeds on sale of property | 0.3 | – | 2.0 | – | |||||
| Decommissioning expenditures | (3.2 | ) | (2.4 | ) | (5.5 | ) | (5.0 | ) | |
| Free funds flow (deficiency) | 3.6 | 3.6 | 15.0 | (18.6 | ) | ||||
Free Funds Flow Yield
Free funds flow yield is a non-IFRS ratio used by management to quantify how much free cash flow is generated by Bonterra relative to its market value. Free funds flow yield is defined as free funds flow divided by the weighted average basic shares outstanding multiplied by the Company’s common share price for the relevant periods.
Net Debt and Net Debt to EBITDA Ratio
Net debt is a non-IFRS financial measure, calculated as long-term subordinated term debt, subordinated debentures, subordinated notes and bank debt plus working capital deficiency (current liabilities less current assets). Net debt to EBITDA is a non-IFRS ratio. Net debt to EBITDA is calculated as net debt divided by EBITDA for the trailing twelve months. EBITDA is a non-IFRS financial measure. EBITDA is a measure showing net earnings excluding deferred consideration, finance costs, provision for current and deferred taxes, depletion and depreciation, share-based compensation, gain or loss on sale of assets, impairment or impairment reversal, extinguishment of debt and unrealized gain or loss on risk management contracts.
The following is a reconciliation of trailing twelve-month EBITDA to the most directly comparable IFRS measure, “Net earnings”:
| ($ millions) | September 30, 2025 | December 31, 2024 | ||
| Bank debt | 26.0 | 46.2 | ||
| Subordinated term debt | – | 35.8 | ||
| Subordinated debentures | – | 55.9 | ||
| Subordinated notes | 131.9 | – | ||
| Current liabilities | 39.9 | 61.4 | ||
| Current assets | (30.0 | ) | (32.0 | ) |
| Net debt | 167.8 | 167.3 | ||
| Net earnings (loss) | (14.7 | ) | 10.2 | |
| Adjustments to net earnings (loss) : | ||||
| Unrealized loss on risk management contracts | 2.1 | 1.5 | ||
| Gain on sale of property | (4.5 | ) | – | |
| Deferred consideration | (1.0 | ) | (1.0 | ) |
| Finance costs | 23.2 | 26.5 | ||
| Share-based compensation | 2.8 | 2.3 | ||
| Depletion and depreciation | 103.0 | 97.1 | ||
| Extinguishment of debt | 11.6 | – | ||
| Current income tax expense (recovery) | (0.5 | ) | 5.2 | |
| Deferred income tax recovery | (3.3 | ) | (1.5 | ) |
| EBITDA (trailing twelve months) | 118.7 | 140.3 | ||
| Net debt to EBITDA ratio | 1.4 | 1.2 | ||
Forward Looking Information
Certain statements contained in this release include statements which contain words such as “anticipate”, “could”, “should”, “expect”, “seek”, “may”, “intend”, “likely”, “will”, “believe” and similar expressions, relating to matters that are not historical facts, and such statements of our beliefs, intentions and expectations about development, results and events which will or may occur in the future, constitute “forward-looking information” within the meaning of applicable Canadian securities legislation and are based on certain assumptions and analysis made by us derived from our experience and perceptions. Forward-looking information in this release includes, but is not limited to: the Company’s 2026 budget and 2026 financial and operating guidance relating to production, funds flow, free funds flow, capital expenditures, operating costs, asset retirement obligations, netback, indebtedness and pricing; exploration and development activities; expectations regarding the allocation of capital expenditures; the closing of the Charlie Lake acquisition and the anticipated benefits of the acquisition; financing arrangements for the Charlie Lake acquisition and expected increases to the borrowing base capacity under the Company’s revolving credit facility; expectations relating to debt repayment and return of capital strategy; abandonment and reclamation activities; risk management strategy; oil and natural gas prices and demand; expansion and other development trends of the oil and gas industry; business strategy and outlook; expansion and growth of our business and operations; maintenance of existing customer, supplier and partner relationships; supply channels; and other such matters.
All such forward-looking information is based on certain assumptions and analyses made by us in light of our experience and perception of historical trends, current conditions and expected future developments, as well as other factors we believe are appropriate in the circumstances. The risks, uncertainties, and assumptions are difficult to predict and may affect operations, and may include, without limitation: foreign exchange fluctuations; equipment and labour shortages and inflationary costs; general economic conditions; industry conditions; changes in applicable environmental, taxation and other laws and regulations as well as how such laws and regulations may limit growth or operations within the oil and gas industry; the impact of climate-related financial disclosures on financial results; the ability of the Company to raise capital, maintain its syndicated bank facility and refinance indebtedness upon maturity; the effect of weather conditions on operations and facilities; the existence of operating risks; volatility of oil and natural gas prices; oil and gas product supply and demand; risks inherent in the ability to generate sufficient cash flow from operations to meet current and future obligations; increased competition; stock market volatility; credit risks; climate change risks; cyber security; opportunities available to or pursued by us; and other factors, many of which are beyond our control. The foregoing factors are not exhaustive. Readers are encouraged to review the material risks discussed in the Company’s latest annual information forum under the heading “Risk Factors”.
In addition, to the extent that any forward-looking information presented herein constitutes future-oriented financial information or financial outlook, as defined by applicable securities legislation, such information has been approved by management of the Company and has been presented to provide management’s expectations used for budgeting and planning purposes and for providing clarity with respect to the Company’s strategic direction based on the assumptions presented herein and readers are cautioned that this information may not be appropriate for any other purpose.
Actual results, performance or achievements could differ materially from those expressed in, or implied by, this forward-looking information and, accordingly, no assurance can be given that any of the events anticipated by the forward-looking information will transpire or occur, or if any of them do, what benefits will be derived therefrom. Except as required by law, Bonterra disclaims any intention or obligation to update or revise any forward-looking information, whether as a result of new information, future events or otherwise.
The forward-looking information contained herein is expressly qualified by this cautionary statement.
Frequently recurring terms
Bonterra uses the following frequently recurring terms in this press release: “WTI” refers to West Texas Intermediate, a grade of light sweet crude oil used as benchmark pricing in the United States; “MSW Stream Index” or “Edmonton Par” refers to the mixed sweet blend that is the benchmark price for conventionally produced light sweet crude oil in Western Canada; “AECO” is the benchmark price for natural gas in Alberta, Canada; “bbl” refers to barrel; “NGL” refers to Natural gas liquids; “MCF” refers to thousand cubic feet; “MMBTU” refers to million British Thermal Units; “GJ” refers to gigajoule; and “BOE” refers to barrels of oil equivalent. Disclosure provided herein in respect of a BOE may be misleading, particularly if used in isolation. A BOE conversion ratio of 6 MCF: 1 bbl is based on an energy conversion method primarily applicable at the burner tip and does not represent a value equivalency at the wellhead.
References in this press release to peak rates, initial production rates, test rates and other short-term production rates are useful in confirming the presence of hydrocarbons, however such rates are not determinative of the rates at which such wells will commence production and decline thereafter and are not indicative of long-term performance or of ultimate recovery. While encouraging, readers are cautioned not to place reliance on such rates in calculating the aggregate production of Bonterra. The Company cautions that such results should be considered preliminary.
Numerical Amounts
The reporting and the functional currency of the Company is the Canadian dollar.
The TSX does not accept responsibility for the accuracy of this release.
A photo accompanying this announcement is available at https://www.globenewswire.com/NewsRoom/AttachmentNg/3cd1c9d5-0b6e-43da-b5a6-1a3c42fe299f
![]()
