America’s Car-Mart Reports Second Quarter Fiscal Year 2026 Results
ROGERS, Ark., Dec. 04, 2025 (GLOBE NEWSWIRE) — America’s Car-Mart, Inc. (NASDAQ: CRMT) (“we,” “Car-Mart” or the “Company”), today reported financial results for the second quarter ended October 31, 2025.
| Second Quarter Key Highlights (FY’26 Q2 vs. FY’25 Q2, unless otherwise noted) |
- Closed $300.0 million term loan and repaid revolving line of credit balance, enhancing capital structure and expanding flexibility to support originations and operations
- Total cash, including restricted cash, increased to $251.0 million from $124.5 million at the start of the fiscal year
- Interest expense decreased 13.1%, reflecting improvements to the securitization platform and a more favorable interest rate environment
- Credit applications were up 14.6%
- Accounts over 30 days past due improved 36 basis points year-over-year, and 62 basis points sequentially (from 3.76% prior quarter to 3.14% this quarter end)
- Total collections increased 4.6% to $181.7 million, outpacing growth in finance receivables of 2.8%
- Interest income increased $2.4 million, or 3.9%
- Total revenue was $350.2 million, up 0.8%
- Gross margin percentage decreased 190 basis points to 37.5, the prior year quarter included a 290 basis points benefit from a one-time service contract accounting change
- Allowance for credit loss increased to 24.19%, increased sequentially from 23.35%, and decreased from 24.72% at October 31, 2024
- Sales volumes decreased 1.1% to 13,637 units
- Net charge-offs as a % of average finance receivables were 7.0% vs. 6.6%
- Loss per share of $2.71; Adjusted loss per share1 of $0.79
________________________
1 Calculation of this non-GAAP financial measure and a reconciliation to the most directly comparable GAAP measure are included in the tables accompanying this release.
President and CEO Doug Campbell commentary:
“Our second quarter financial results reflect the continued progress we are making to transform our business for the future, even as we navigate a fluid operating backdrop. We are proactively repositioning America’s Car-Mart by investing in our infrastructure, optimizing our platform, and improving our capital structure. These strategic actions are designed to deliver sustainable growth, enhance profitability at the unit level, and position the business for long-term success and value creation.
“At the end of our second fiscal quarter, we successfully closed a new $300 million term loan and fully repaid the outstanding balance under our revolving line of credit. This was a significant step forward that provides us with greater flexibility and control over our balance sheet, while removing restrictive income statement covenants that previously limited our ability to make strategic decisions. With these constraints lifted, we are moving decisively to optimize our cost structure, improve profitability, and pursue additional actions to further strengthen our capital structure.
“Completing the term loan transaction also allowed us to access the substantial amount of residual equity that sits within our asset-backed securitization (ABS) platform differently than how those non-recourse notes were treated under our revolving credit line. Because the ABS bonds we issue are short-term, equity builds quickly in these transactions. Unlocking this equity enhances our flexibility to fund the business in a unique and efficient manner. Looking ahead, planned enhancements to our ABS platform will further improve efficiency and deliver greater benefits to the Company.
“Subsequent to quarter-end, we closed five underperforming stores and transitioned the customers served by those stores and store inventory to six nearby, higher-performing locations. This action ensures we continue serving our customers while sharpening our operational focus on our most productive dealerships. This is another step in positioning the Company for growth, improving cash generation, and a return to positive GAAP earnings. We will continue to evaluate store performance to ensure we are sized appropriately.
“Our LOS V2 underwriting platform, which was rolled out last quarter, is enhancing the quality of new originations and we are encouraged by early results—credit losses from contracts originated under our new system are tracking better than contracts under our legacy system. In addition, our new Pay Your Way program has begun to improve our collections performance. We expect our upcoming implementation of a new Salesforce-backed collections management system to further strengthen our collections efforts. Together, these initiatives are adding best-in-class capabilities that are helping us execute in a challenging market environment.
“While we still have work to do, I am confident that the actions underway today will position us for meaningful growth and improved profitability in the years ahead. I am proud of the strength, resilience, and execution ability of our team, which continues to drive these efforts forward with focus and determination.”
Dollars in thousands, except per share data. Dollar and percentage changes may not recalculate due to rounding. Charts may not be to scale.
| Second Quarter Fiscal Year 2026 Key Operating Metrics |
Booked Customer Credit Applications by Credit Rank and Variance2
Q2FY26 vs. FY25 Average
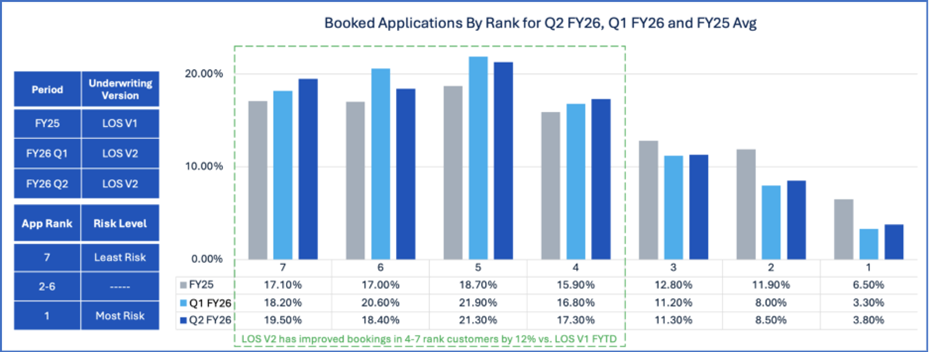
2 Represents the percentage of total booked credit applications from customers in each credit ranking (1-7) under our proprietary credit scoring and underwriting guidelines. A credit application is deemed to be booked (or recorded) when the customer purchases a vehicle and enters into a retail installment sale contract to finance their vehicle purchase.
In May 2025, Car-Mart deployed and implemented the next generation of the Company’s loan origination system (LOS V2) for processing customer credit applications. This new rollout had two primary benefits, a predictive scorecard and the enablement of risk-based pricing. The new scorecard more accurately identifies risk by assigning ranks to customers with better granularity. The Company has updated underwriting rules to book a higher proportion of higher-ranking customers.
The Company’s underwriting approach remained consistent between the first and second quarters of this fiscal year. The above chart reflects applications booked during the first and second quarter of this fiscal year when compared to all booked applications in fiscal year 2025 on LOS V1. In the second quarter, the Company continued to see a meaningful shift towards the higher ranked customers with over 12% more customers booked in ranks 4-7, which have lower projected probability of loss and stronger expected overall returns.
| Second Quarter Business Review |
Note: Discussions in each section provide information for the second quarter of fiscal year 2026, compared to the second quarter of fiscal year 2025, unless otherwise noted.
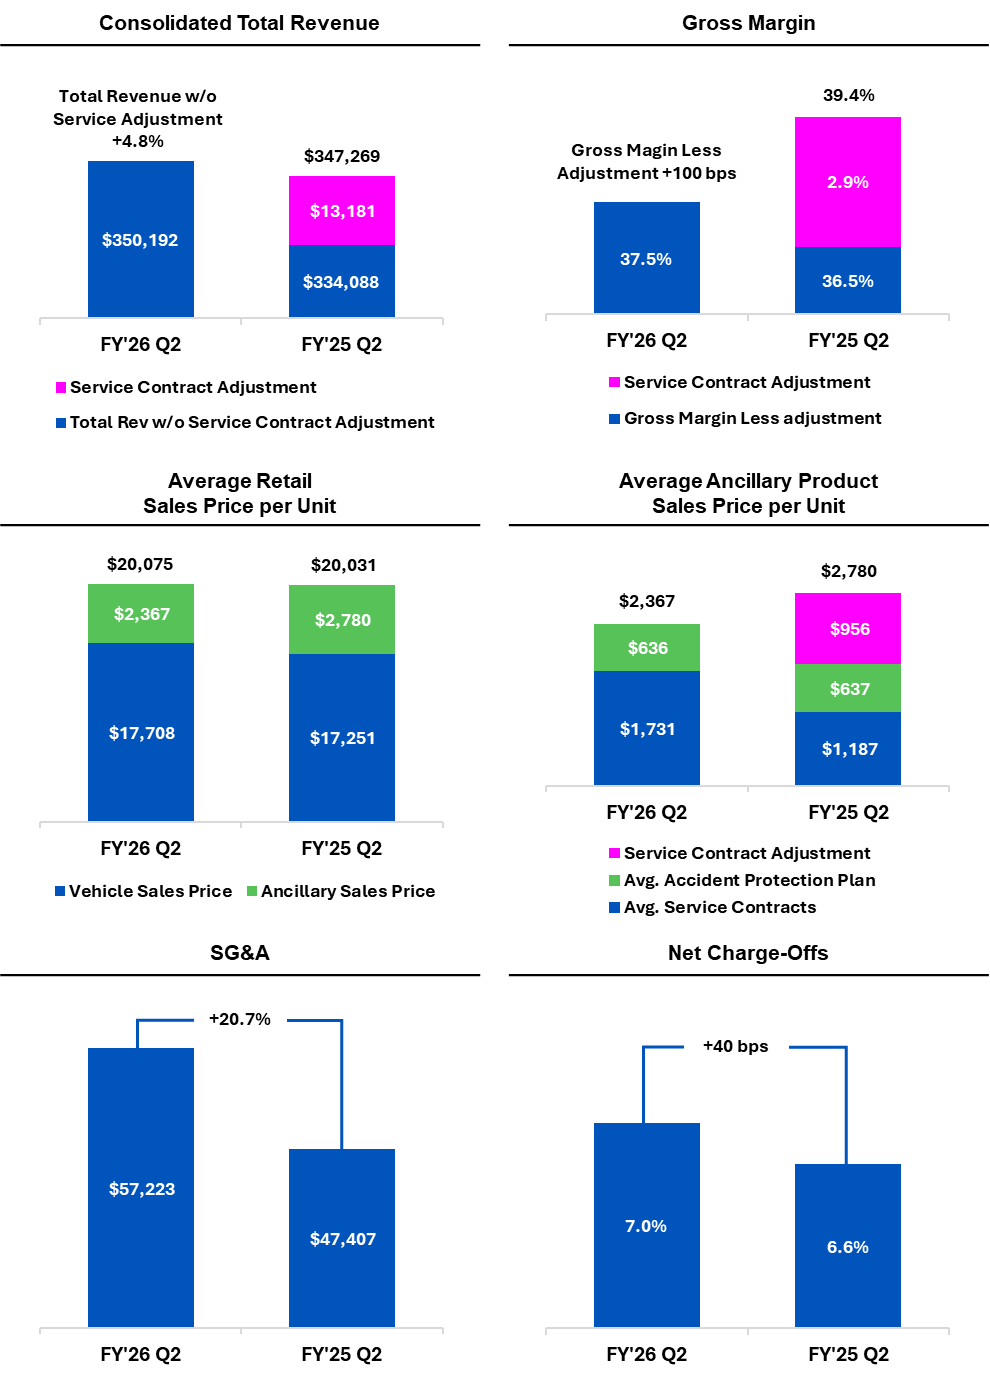
TOTAL REVENUE – Total revenue for the quarter was $350.2 million, an increase of 0.8% year-over-year which included a $13.2 million one-time benefit received last year from a change in service contract revenue recognition. Absent the $13.2 million benefit in the prior year, revenue on an adjusted basis (non-GAAP)1 would have grown 4.8% year-over-year. This growth was driven by 3.9% higher interest income and an increase in the average retail sales price of 2.6% or $457 per unit. The increase in sales price was driven by higher average procurement costs outlined in the prior quarter. The mild increase in sales price was absorbed by the overall higher rated consumers who purchased vehicles during the quarter.
SALES – Sales volumes declined 1.1% to 13,637 units compared to 13,784 in the prior year, primarily driven by capital constraints outlined in the prior quarter. These results were notable despite finishing the quarter with approximately 6.8% less in inventory dollars than in the first quarter of this fiscal year. Credit application volume, which we believe demonstrates strong demand for our offering, was 14.6% higher year-over-year despite fewer units being available for sale on average during the quarter.
GROSS PROFIT – Gross profit margin as a percentage of sales was 37.5% compared to 39.4% in the prior year’s quarter. The prior year quarter included a 290-basis point benefit from the one-time change in service contract revenue recognition in the prior year. Sequentially, gross profit margin as a percentage of sales improved by 90 basis points on similar sales volume. The sequential and year-over-year improvement in gross margin percentage, absent the one-time benefit in the prior year quarter, resulted from stronger wholesale retention, and a reduction in both frequency and severity of repair costs.
SG&A EXPENSE – SG&A expenses totaled $57.2 million for the quarter, which included $3.5 million in one-time expenses primarily driven by store impairment costs related to five store closures. SG&A as a percentage of sales was 20.0%. Excluding one-time charges, SG&A as a percentage of sales, as adjusted (non-GAAP)1, was 18.8%. The Company initiated a multi-phased plan to reduce SG&A as a percentage of sales, with a target of approximately 16.5%.
In November 2025, the Company closed five underperforming locations by consolidating those operations into nearby, better-performing stores. This ensures the Company continues serving its customers while reducing occupancy costs, simplifying field operations, and improving efficiency without compromising service or collection capabilities. The Company believes it will be able to retain a similar level of sales penetration and rate of collections by reallocating resources and inventory to better performing locations. The closures are projected to save $1 million in fiscal 2026 and $2 million annually, boosting pre-tax net income. Recent actions, which the Company was previously limited from undertaking due to the financial covenants in its revolving line of credit, demonstrate how added flexibility from the term loan supports the Company’s journey toward improved profitability. The Company also took steps during the quarter to reduce its ongoing personnel expense, as well as IT and marketing expenses. Store closures plus additional expense reduction actions are estimated to generate expense savings of $4.9 million during the remainder of fiscal year 2026 and approximately $10.1 million on an annualized basis.
CREDIT AND UNDERWRITING PERFORMANCE – Contracts originated under the Company’s enhanced LOS underwriting platform continue to outperform contracts under our legacy platform, with aggregate loss data tracking lower at the same number of months since origination. This improvement reflects tighter credit standards and risk-based pricing Car-Mart has implemented over the past 18 months. Contracts originated under these enhanced standards now represent 76.6% of the outstanding portfolio balance, excluding non-integrated acquisition lots, up from 71.7% sequentially, and Car-Mart expects portfolio quality to continue improving as legacy originations run off.
Net charge-offs (NCOs) totaled $106.3 million compared to $100.1 million in the first quarter, and NCOs as a percentage of average finance receivables increased to 7.0% from 6.6% in the prior year and 6.6% sequentially. The increase in losses reflects both the effects on the Company’s customer base from the macroeconomic environment and normal portfolio seasoning such as maturation of acquired dealership portfolios. Loss severity declined from $10,677 to $10,325 per unit, and credit loss data reflects that more recent originations are tracking to lower cumulative losses compared to contracts originated under the Company’s legacy underwriting system. Meanwhile, legacy portfolio losses are declining as the portion of the portfolio represented by these contracts continues to decrease.
Despite higher charge-offs, credit metrics remained stable or improved over the prior year quarter. These leading indicators showed contract modification activity decreased from 6.9% to 6.2%, total collections grew 4.6% outpacing portfolio growth of 2.8%, and 30+ day delinquencies improved to 3.14% from 3.76%.
The average down payment was 4.8% of the average retail sales price, down from 5.2% in the prior year’s second quarter. Average originating term was 44.3 months, up 0.1 months from the prior year. The weighted average contract term within the portfolio modestly increased to 48.5 months, up 0.3 months year-over-year.
ALLOWANCE FOR CREDIT LOSSES – Allowance for credit losses as a percentage of finance receivables was 24.19% as of October 31, 2025, compared to 24.72% on October 31, 2024. Sequentially, the allowance increased from 23.35% on July 31, 2025. The Company’s CECL reserve is based on historical loss trends and adjusts as the portfolio changes. The Company also continues to monitor external factors that may impact its customer base, including persistent inflation and potential government policy changes that could affect SNAP beneficiaries and other assistance programs. While underlying credit quality is improving, the reserve appropriately reflects these macroeconomic uncertainties.
PROVISION FOR CREDIT LOSSES – The provision for credit loss was $119.1 million compared to $99.5 million in the prior year quarter. The $19.6 million year-over-year increase was primarily driven by the 40-basis point increase in net charge-offs, reserve adjustments reflecting continued maturation of customer receivables originated from acquired dealerships as those receivables build loss history, macroeconomic factors including persistent inflation and uncertainty surrounding the recent government shutdown and potential impacts to government assistance programs in calendar year 2026.
LEVERAGE & LIQUIDITY – Debt to finance receivables and debt, net of cash, to finance receivables (non-GAAP1) were 59.2% and 42.6% at October 31, 2025, respectively, compared to 51.8% and 43.0% on October 31, 2024, and 51.5% and 43.2% at the start of fiscal year 2026.
During the second quarter, the Company made significant progress in transforming its capital structure. On October 30, 2025, the Company closed a $300 million term loan and fully repaid and retired its revolving line of credit, eliminating restrictive income statement covenants and providing greater financial flexibility. Since the start of the fiscal year, the Company also completed two ABS transactions (2025-2 and 2025-3) and redeemed and paid off the 2023-1 ABS transaction in August.
Total cash, including restricted cash, increased to $251.0 million on October 31, 2025, compared to $124.5 million on April 30, 2025. Debt, net of total cash, (non-GAAP)1 decreased to $646.0 million from $652.2 million on April 30, 2025, despite the increase in gross debt related to the term loan. This reflects disciplined capital management and improved cash generation. The natural amortization of the Company’s ABS structures and the maturation of receivables are also important components of Car-Mart’s deleveraging strategy, as maturing transactions free up collateral for other uses.
Interest expense decreased $2.4 million, or 13.1%, year-over-year, benefiting from improvements made to the securitization platform and a more favorable interest rate environment.
FINANCINGS – On October 30, 2025, the Company completed a new five-year, $300 million funded term loan facility provided by funds managed by Silver Point Capital, L.P. In connection with this transaction, the Company issued Silver Point and its affiliate funds six-year warrants to purchase up to an aggregate of 937,487 shares of the Company’s common stock at an exercise price of $22.63, subject to customary adjustments and including customary registration rights for the resale of the underlying shares. The Company used a portion of the proceeds from the term loan to fully repay the outstanding balance under its revolving line of credit, simplifying its balance sheet and creating a more flexible and scalable capital structure to support long-term growth opportunities and general corporate purposes.
The Company incurred $4.5 million in one-time charges associated with the early extinguishment of its revolving line of credit. The Company continues to explore options to diversify and expand its financing sources, including potential warehouse lines of credit, and will remain active in the asset-backed securities market. The Company currently anticipates executing a revolving warehouse line of credit and an additional ABS transaction during the second half of fiscal year 2026.
OUTLOOK – The Company remains focused on executing its strategic priorities: optimizing the cost structure, strengthening credit performance through disciplined underwriting, and completing the capital structure transformation. As Car-Mart completes the capital structure transformation, management expects inventory levels to normalize, supporting improved productivity across its dealership network. Actions taken during the quarter and after quarter end, including the term loan closing, store consolidations, and ongoing cost initiatives, are expected to drive meaningful improvement in operating leverage and position the Company for a return to positive GAAP earnings. As performance improves, management remains committed to deploying capital in ways that maximize long-term shareholder value, whether through organic growth, strategic acquisitions, return of capital over time, or other strategic opportunities.
________________________
1 Calculation of this non-GAAP financial measure and a reconciliation to the most directly comparable GAAP measure are included in the tables accompanying this release.
| Key Operating Results | |||||||||||||
| Three Months Ended | |||||||||||||
| October 31, | |||||||||||||
| 2025 | 2024 | % Change | |||||||||||
| Operating Data: | |||||||||||||
| Retail units sold | 13,637 | 13,784 | (1.1 | ) | % | ||||||||
| Average number of stores in operation | 154 | 154 | – | ||||||||||
| Average retail units sold per store per month | 29.5 | 29.8 | (1.0 | ) | |||||||||
| Average retail sales price | $ | 20,075 | $ | 20,031 | 0.2 | ||||||||
| Total gross profit per retail unit sold | $ | 7,868 | $ | 8,166 | (3.6 | ) | |||||||
| Total gross profit percentage | 37.5 | % | 39.4 | % | |||||||||
| Same store revenue growth | (0.2 | )% | (8.4 | )% | |||||||||
| Net charge-offs as a percent of average finance receivables | 7.0 | % | 6.6 | % | |||||||||
| Total collected (principal, interest and late fees),in thousands | $ | 181,738 | $ | 173,778 | 4.6 | ||||||||
| Average total collected per active customer per month | $ | 580 | $ | 560 | 3.6 | ||||||||
| Average percentage of finance receivables-current (excl. 1-2 day) | 79.7 | % | 81.8 | % | |||||||||
| Average down-payment percentage | 4.8 | % | 5.2 | % | |||||||||
| Six Months Ended | |||||||||||||
| October 31, | |||||||||||||
| 2025 | 2024 | % Change | |||||||||||
| Operating Data: | |||||||||||||
| Retail units sold | 27,205 | 28,175 | (3.4 | ) | % | ||||||||
| Average number of stores in operation | 154 | 155 | (0.6 | ) | |||||||||
| Average retail units sold per store per month | 29.4 | 30.3 | (3.0 | ) | |||||||||
| Average retail sales price | $ | 19,820 | $ | 19,650 | 0.9 | ||||||||
| Total gross profit per retail unit sold | $ | 7,662 | $ | 7,568 | 1.2 | ||||||||
| Total gross profit percentage | 37.1 | % | 37.2 | % | |||||||||
| Same store revenue growth | (2.2 | )% | (8.2 | )% | |||||||||
| Net charge-offs as a percent of average finance receivables | 13.6 | % | 13.0 | % | |||||||||
| Total collected (principal, interest and late fees),in thousands | $ | 365,308 | $ | 346,650 | 5.4 | ||||||||
| Average total collected per active customer per month | $ | 582 | $ | 561 | 3.7 | ||||||||
| Average percentage of finance receivables-current (excl. 1-2 day) | 80.2 | % | 82.1 | % | |||||||||
| Average down-payment percentage | 4.8 | % | 5.2 | % | |||||||||
| Period End Data: | |||||||||||||
| Stores open | 154 | (1) | 154 | – | % | ||||||||
| Accounts over 30 days past due | 3.3 | % | 3.5 | % | |||||||||
| Active customer count | 103,819 | 103,336 | 0.5 | ||||||||||
| Principal balance of finance receivables(in thousands) | $ | 1,515,413 | $ | 1,473,794 | 2.8 | ||||||||
| Weighted average total contract term | 48.5 | 48.2 | 0.6 | ||||||||||
| (1) | Store count was 154 at October 31, 2025; five stores closed subsequently to quarter-end. | ||||||||||||
| Conference Call and Webcast |
The Company will hold a conference call to discuss its quarterly results on December 4, at 9:00 a.m. ET. Participants may access the conference call via webcast using this link: Webcast Link. To participate via telephone, please register in advance using this Registration Link. Upon registration, all telephone participants will receive a one-time confirmation email detailing how to join the conference call, including the dial-in number along with a unique PIN that can be used to access the call. All participants are encouraged to dial in 10 minutes prior to the start time. A replay and transcript of the conference call and webcast and related supplemental information will be available on-demand via the Company’s investor relations webpage at ir.car-mart.com for 12 months.
| About America’s Car-Mart, Inc. |
America’s Car-Mart, Inc. (the “Company”) operates automotive dealerships in 12 states and is one of the largest publicly held automotive retailers in the United States focused exclusively on the “Integrated Auto Sales and Finance” segment of the used car market. The Company emphasizes superior customer service and the building of strong personal relationships with its customers. The Company operates its dealerships primarily in smaller cities throughout the South-Central United States, selling quality used vehicles and providing financing for substantially all of its customers. For more information about America’s Car-Mart, including investor presentations, please visit our website at www.car-mart.com.
| Non-GAAP Financial Measures |
This news release contains financial information determined by methods other than in accordance with generally accepted accounting principles (GAAP). In addition to total debt, net of total cash, to finance receivables, we also present adjusted revenue, adjusted SG&A as a percentage of sales, adjusted earnings (loss) per share, and certain economic return metrics, including cash-on-cash returns and internal rates of return (IRR) for our finance receivable pools. These non-GAAP measures are provided as supplemental measures to evaluate operating performance, cost structure, leverage, and portfolio economics, and to facilitate period-to-period comparisons that may be impacted by non-recurring or non-cash items.
These measures should not be considered in isolation or as substitutes for reported GAAP results, as they may include or exclude certain items relative to similar GAAP-based measures and may not be comparable to similarly titled measures reported by other companies. We strongly encourage investors to review our consolidated financial statements included in our publicly filed reports in their entirety and not rely solely on any one financial measure or communication. The most directly comparable GAAP financial measures, as well as reconciliations to those measures, are presented in the tables accompanying this release.
| Forward-Looking Statements |
This news release contains “forward-looking statements” within the meaning of the Private Securities Litigation Reform Act of 1995. These forward-looking statements address the Company’s future objectives, plans and goals, as well as the Company’s intent, beliefs and current expectations and projections regarding future financial and operating performance and can generally be identified by words such as “may,” “will,” “should,” “could,” “expect,” “anticipate,” “intend,” “plan,” “project,” “foresee,” and other similar words or phrases. Specific events addressed by these forward-looking statements may include, but are not limited to:
- future earnings performance;
- the benefits of recent changes to the Company’s capital structure;
- operational infrastructure investments;
- same dealership sales and revenue growth;
- performance of new and existing dealerships;
- customer growth and engagement;
- gross profit percentages;
- gross profit per retail unit sold;
- business acquisitions;
- inventory acquisition, reconditioning, transportation, and remarketing;
- technological investments and initiatives;
- future revenue growth;
- receivables growth as related to revenue growth;
- interest rates;
- future credit losses;
- the Company’s collection results, including but not limited to collections during income tax refund periods;
- cash-on-cash returns from the collection of contracts originated by the Company;
- seasonality; and
- the Company’s business, operating and growth strategies and expectations.
These forward-looking statements are based on the Company’s current estimates and assumptions and involve various risks and uncertainties. As a result, you are cautioned that these forward-looking statements are not guarantees of future performance, and that actual results could differ materially from those projected in these forward-looking statements. Factors that may cause actual results to differ materially from the Company’s projections include, but are not limited to:
- general economic conditions in the markets in which the Company operates, including but not limited to fluctuations in gas prices, grocery prices and employment levels and inflationary pressure on operating costs;
- the availability of quality used vehicles at prices that will be affordable to our customers, including the impacts of changes in new vehicle production and sales;
- the ability to leverage the Cox Automotive services agreement to perform reconditioning and improve vehicle quality to reduce the average vehicle cost, improve gross margins, reduce credit loss, and enhance cash flow;
- the availability of credit facilities and access to capital through securitization financings or other sources on terms acceptable to us, and any increase in the cost of capital, to support the Company’s business;
- the Company’s ability to underwrite and collect its contracts effectively, including whether anticipated benefits from recent upgrades to the Company’s loan origination system, recently implemented digital payment platform and anticipated upgrades to the Company’s collections management software are achieved as expected or at all;
- competition;
- dependence on existing management;
- ability to attract, develop, and retain qualified general managers;
- changes in consumer finance laws or regulations, including but not limited to rules and regulations that have recently been enacted or could be enacted by federal and state governments;
- future shutdowns of the federal government or changes to federal or state government assistance programs impacting the Company’s customers;
- the ability to keep pace with technological advances and changes in consumer behavior affecting our business;
- security breaches, cyber-attacks, or fraudulent activity;
- the ability to identify and obtain favorable locations for new or relocated dealerships at reasonable cost;
- the ability to successfully transition customers and inventory from underperforming dealerships to nearby more productive dealerships;
- the ability to successfully identify, complete and integrate new acquisitions;
- the occurrence and impact of any adverse weather events or other natural disasters affecting the Company’s dealerships or customers; and
- potential business and economic disruptions and uncertainty that may result from any future public health crises and any efforts to mitigate the financial impact and health risks associated with such developments.
Additionally, risks and uncertainties that may affect future results include those described from time to time in the Company’s SEC filings. The Company undertakes no obligation to update or revise any forward-looking statements, whether as a result of new information, future events or otherwise. Readers are cautioned not to place undue reliance on these forward-looking statements, which speak only as of the dates on which they are made.
SM Berger & Company
Andrew Berger, Managing Director
andrew@smberger.com
(216) 464-6400
| America’s Car-Mart Consolidated Results of Operations (Amounts in thousands, except per share data) | |||||||||||||||||||||||
| As a % of Sales | |||||||||||||||||||||||
| Three Months Ended | Three Months Ended | ||||||||||||||||||||||
| October 31, | October 31, | ||||||||||||||||||||||
| 2025 | 2024 | % Change | 2025 | 2024 | |||||||||||||||||||
| Statements of Operations: | |||||||||||||||||||||||
| Revenues: | |||||||||||||||||||||||
| Sales | $ | 286,313 | $ | 285,774 | 0.2 | % | 100.0 | % | 100.0 | % | |||||||||||||
| Interest income | 63,879 | 61,495 | 3.9 | 22.3 | 21.5 | ||||||||||||||||||
| Total | 350,192 | 347,269 | 0.8 | 122.3 | 121.5 | ||||||||||||||||||
| . | |||||||||||||||||||||||
| Costs and expenses: | |||||||||||||||||||||||
| Cost of sales | 179,016 | 173,215 | 3.3 | 62.5 | 60.6 | ||||||||||||||||||
| Selling, general and administrative | 57,223 | 47,407 | 20.7 | 20.0 | 16.6 | ||||||||||||||||||
| Provision for credit losses | 119,074 | 99,522 | 19.6 | 41.6 | 34.8 | ||||||||||||||||||
| Interest expense | 15,685 | 18,042 | (13.1 | ) | 5.5 | 6.3 | |||||||||||||||||
| Loss on extinguishment of debt | 4,476 | – | 100.0 | 1.6 | – | ||||||||||||||||||
| Depreciation and amortization | 2,102 | 1,926 | 9.1 | 0.7 | 0.7 | ||||||||||||||||||
| Loss on disposal of property and equipment | 100 | 41 | 143.9 | 0.0 | 0.0 | ||||||||||||||||||
| Total | 377,676 | 340,153 | 11.0 | 131.9 | 119.0 | ||||||||||||||||||
| Income (Loss) before taxes | (27,484 | ) | 7,116 | (9.6 | ) | 2.5 | |||||||||||||||||
| (Benefit) provision for income taxes | (5,011 | ) | 2,017 | (1.8 | ) | 0.7 | |||||||||||||||||
| Net income (loss) | $ | (22,473 | ) | $ | 5,099 | (7.8 | ) | 1.8 | |||||||||||||||
| Dividends on subsidiary preferred stock | (10 | ) | (10 | ) | |||||||||||||||||||
| Net income (loss) attributable to common shareholders | $ | (22,483 | ) | $ | 5,089 | ||||||||||||||||||
| Earnings (Loss) per share: | |||||||||||||||||||||||
| Basic | $ | (2.71 | ) | $ | 0.62 | ||||||||||||||||||
| Diluted | $ | (2.71 | ) | $ | 0.61 | ||||||||||||||||||
| Weighted average number of shares used in calculation: | |||||||||||||||||||||||
| Basic | 8,283,116 | 8,147,971 | |||||||||||||||||||||
| Diluted | 8,283,116 | 8,292,459 | |||||||||||||||||||||
| America’s Car-Mart Consolidated Results of Operations (Amounts in thousands, except per share data) | |||||||||||||||||||||||
| As a % of Sales | |||||||||||||||||||||||
| Six Months Ended | Six Months Ended | ||||||||||||||||||||||
| October 31, | October 31, | ||||||||||||||||||||||
| 2025 | 2024 | % Change | 2025 | 2024 | |||||||||||||||||||
| Statements of Operations: | |||||||||||||||||||||||
| Revenues: | |||||||||||||||||||||||
| Sales | $ | 562,553 | $ | 573,022 | (1.8 | ) | % | 100.0 | % | 100.0 | % | ||||||||||||
| Interest income | 128,729 | 122,010 | 5.5 | 22.9 | 21.3 | ||||||||||||||||||
| Total | 691,282 | 695,032 | (0.5 | ) | 122.9 | 121.3 | |||||||||||||||||
| Costs and expenses: | |||||||||||||||||||||||
| Cost of sales | 354,096 | 359,785 | (1.6 | ) | 62.9 | 62.8 | |||||||||||||||||
| Selling, general and administrative | 108,409 | 94,118 | 15.2 | 19.3 | 16.4 | ||||||||||||||||||
| Provision for credit losses | 222,109 | 194,945 | 13.9 | 39.5 | 34.0 | ||||||||||||||||||
| Interest expense | 32,727 | 36,354 | (10.0 | ) | 5.8 | 6.3 | |||||||||||||||||
| Loss on extinguishment of debt | 4,476 | – | 100.0 | 0.8 | – | ||||||||||||||||||
| Depreciation and amortization | 4,241 | 3,810 | 11.3 | 0.8 | 0.7 | ||||||||||||||||||
| Loss on disposal of property and equipment | 109 | 87 | 25.3 | 0.0 | 0.0 | ||||||||||||||||||
| Total | 726,167 | 689,099 | 5.4 | 129.1 | 120.2 | ||||||||||||||||||
| Income (Loss) before taxes | (34,885 | ) | 5,933 | (6.2 | ) | 1.0 | |||||||||||||||||
| (Benefit) provision for income taxes | (6,677 | ) | 1,798 | (1.2 | ) | 0.3 | |||||||||||||||||
| Net income (loss) | $ | (28,208 | ) | $ | 4,135 | (5.0 | ) | 0.7 | |||||||||||||||
| Dividends on subsidiary preferred stock | (20 | ) | (20 | ) | |||||||||||||||||||
| Net income (loss) attributable to common shareholders | $ | (28,228 | ) | $ | 4,115 | ||||||||||||||||||
| Earnings (Loss) per share: | |||||||||||||||||||||||
| Basic | $ | (3.41 | ) | $ | 0.57 | ||||||||||||||||||
| Diluted | $ | (3.41 | ) | $ | 0.55 | ||||||||||||||||||
| Weighted average number of shares used in calculation: | |||||||||||||||||||||||
| Basic | 8,278,585 | 7,272,364 | |||||||||||||||||||||
| Diluted | 8,278,585 | 7,423,936 | |||||||||||||||||||||
| America’s Car-Mart Condensed Consolidated Balance Sheet and Other Data (Amounts in thousands, except per share data) | |||||||||||||
| October 31, | April 30, | October 31, | |||||||||||
| 2025 | 2025 | 2024 | |||||||||||
| Cash and cash equivalents | $ | 122,362 | $ | 9,808 | $ | 8,006 | |||||||
| Restricted cash from collections on auto finance receivables | $ | 128,609 | $ | 114,729 | $ | 121,678 | |||||||
| Finance receivables, net | $ | 1,172,025 | $ | 1,180,673 | $ | 1,132,618 | |||||||
| Inventory | $ | 104,751 | $ | 112,229 | $ | 122,102 | |||||||
| Total assets | $ | 1,717,920 | $ | 1,606,474 | $ | 1,575,176 | |||||||
| Senior Secured Notes Payable, net | $ | 261,912 | $ | – | $ | – | |||||||
| Revolving lines of credit, net | $ | – | $ | 204,769 | $ | 107,365 | |||||||
| Notes payable, net | $ | 635,034 | $ | 572,010 | $ | 656,414 | |||||||
| Treasury stock | $ | 298,496 | $ | 298,220 | $ | 298,198 | |||||||
| Total equity | $ | 555,026 | $ | 569,522 | $ | 553,665 | |||||||
| Shares outstanding | 8,294,520 | 8,263,280 | 8,253,186 | ||||||||||
| Book value per outstanding share | $ | 66.98 | $ | 68.97 | $ | 67.13 | |||||||
| Finance receivables: | |||||||||||||
| Principal balance | $ | 1,515,413 | $ | 1,509,155 | $ | 1,473,794 | |||||||
| Deferred revenue – accident protection plan | (50,320 | ) | (51,458 | ) | (50,956 | ) | |||||||
| Deferred revenue – service contract | (59,255 | ) | (61,787 | ) | (55,645 | ) | |||||||
| PPP O/S claims net of cancelled/denied | (5,362 | ) | (6,231 | ) | (5,287 | ) | |||||||
| Finance receivables, net of PPP Claims and deferred revenue | $ | 1,400,476 | $ | 1,389,679 | $ | 1,361,906 | |||||||
| Allowance for credit losses | (338,827 | ) | (323,100 | ) | (336,693 | ) | |||||||
| Allowance as % of principal balance net of deferred revenue | 24.19% | 23.25% | 24.72% | ||||||||||
| Changes in allowance for credit losses: | |||||||||||||
| Six Months Ended | |||||||||||||
| October 31, | |||||||||||||
| 2025 | 2024 | ||||||||||||
| Balance at beginning of period | $ | 323,100 | $ | 331,260 | |||||||||
| Provision for credit losses | 222,109 | 194,945 | |||||||||||
| Charge-offs, net of collateral recovered | (206,382 | ) | (189,512 | ) | |||||||||
| Balance at end of period | $ | 338,827 | $ | 336,693 | |||||||||
| America’s Car-Mart Condensed Consolidated Statements of Cash Flows (Amounts in thousands) | ||||||||||
| Six Months Ended | ||||||||||
| October 31, | ||||||||||
| 2025 | 2024 | |||||||||
| Operating activities: | ||||||||||
| Net loss | $ | (28,208 | ) | $ | 4,135 | |||||
| Provision for credit losses | 222,109 | 194,945 | ||||||||
| Losses on claims for accident protection plan | 18,466 | 16,797 | ||||||||
| Loss on extinguishment of debt | 2,726 | – | ||||||||
| Depreciation and amortization | 7,441 | 6,467 | ||||||||
| Finance receivable originations | (528,728 | ) | (527,487 | ) | ||||||
| Finance receivable collections | 236,576 | 224,640 | ||||||||
| Inventory | 68,537 | 48,141 | ||||||||
| Deferred accident protection plan revenue | (1,139 | ) | (880 | ) | ||||||
| Deferred service contract revenue | (2,532 | ) | (13,300 | ) | ||||||
| Income taxes, net | (9,155 | ) | 4,521 | |||||||
| Other | 17,048 | 4,815 | ||||||||
| Net cash used in operating activities | 3,141 | (37,206 | ) | |||||||
| Investing activities: | ||||||||||
| Purchase of investments | – | (9,865 | ) | |||||||
| Purchase of property and equipment and other | (1,244 | ) | 24 | |||||||
| Proceeds from sale of property and equipment | 117 | – | ||||||||
| Net cash used in investing activities | (1,127 | ) | (9,841 | ) | ||||||
| Financing activities: | ||||||||||
| Change in revolving credit facility, net | (207,098 | ) | (93,127 | ) | ||||||
| Payments on notes payable | (325,219 | ) | (345,622 | ) | ||||||
| Change in cash overdrafts | (1,289 | ) | 2,074 | |||||||
| Issuances of notes payable | 387,960 | 449,889 | ||||||||
| Debt issuance costs | (39,652 | ) | (4,467 | ) | ||||||
| Purchase of common stock | (20 | ) | (412 | ) | ||||||
| Dividend payments | – | (20 | ) | |||||||
| Exercise of stock options and issuance of common stock | (154 | ) | 73,969 | |||||||
| Loss on extinguishment of debt | (1,750 | ) | – | |||||||
| Issuance of warrants | 11,642 | – | ||||||||
| Issuance of senior secured notes payable | 300,000 | – | ||||||||
| Net cash provided by financing activities | 124,420 | 82,284 | ||||||||
| (Decrease) increase in cash, cash equivalents, and restricted cash | $ | 126,434 | $ | 35,237 | ||||||
| America’s Car-Mart Reconciliation of Non-GAAP Financial Measures (Amounts in thousands) | ||||||||||
| Calculation of Debt, Net of Total Cash, to Finance Receivables: | ||||||||||
| October 31, 2025 | April 30, 2025 | |||||||||
| Debt: | ||||||||||
| Senior Secured Notes Payable, net | $ | 261,912 | $ | – | ||||||
| Revolving lines of credit, net | – | 204,769 | ||||||||
| Notes payable, net | 635,034 | 572,010 | ||||||||
| Total debt | $ | 896,946 | $ | 776,779 | ||||||
| Cash: | ||||||||||
| Cash and cash equivalents | $ | 122,362 | $ | 9,808 | ||||||
| Restricted cash from collections on auto finance receivables | 128,609 | 114,729 | ||||||||
| Total cash, cash equivalents, and restricted cash | $ | 250,971 | $ | 124,537 | ||||||
| Debt, net of total cash | $ | 645,975 | $ | 652,242 | ||||||
| Principal balance of finance receivables | $ | 1,515,413 | $ | 1,509,154 | ||||||
| Ratio of debt to finance receivables | 59.2 | % | 51.5 | % | ||||||
| Ratio of debt, net of total cash, to finance receivables | 42.6 | % | 43.2 | % | ||||||
| Calculation of Adjusted Revenue Percentage: | ||||||||||
| Three Months Ended | Three Months Ended | |||||||||
| October 31, | October 31, | |||||||||
| 2025 | 2024 | |||||||||
| Total revenue | $ | 350,192 | $ | 347,269 | ||||||
| Service contract adjustments to sales | – | 13,181 | ||||||||
| Adjusted total revenue | 350,192 | 334,088 | ||||||||
| Adjusted total revenue percentage increase | 4.8 | % | ||||||||
| Calculation of Adjusted SG&A as a Percentage of Sales: | ||||||||||
| Three Months Ended | Three Months Ended | |||||||||
| October 31, | October 31, | |||||||||
| 2025 | 2024 | |||||||||
| Sales | $ | 286,313 | $ | 285,774 | ||||||
| Selling, general and administrative | 57,223 | 47,407 | ||||||||
| Impairment of assets impacted by lot closures and non-core adjustments | 3,522 | – | ||||||||
| Adjusted selling, general and administrative | 53,701 | 47,407 | ||||||||
| Adjusted SG&A as a percentage of sales | 18.8 | % | ||||||||
| America’s Car-Mart Reconciliation of Non-GAAP Financial Measures (Amounts in thousands) | ||||||||||
| Calculation of Adjusted Earnings (Loss) Per Share: | ||||||||||
| Three Months Ended | Three Months Ended | |||||||||
| October 31, | October 31, | |||||||||
| 2025 | 2024 | |||||||||
| Net income (loss) attributable to common shareholders (D) | $ | (22,483 | ) | $ | 5,089 | |||||
| Service contract adjustments to sales(2) | – | 13,181 | ||||||||
| Loss on extinguishment of debt adjustment(2) | 4,476 | – | ||||||||
| Credit loss impact of allowance percentage adjustment | 11,764 | (3,258 | ) | |||||||
| Impairment of assets impacted by lot closures and non-core adjustments(2) | 3,522 | – | ||||||||
| Pre-tax impact of adjustments (G) | 19,762 | 9,923 | ||||||||
| Tax effect of adjustment (effective tax rate of 19.14% and 28.34%) (H) | (3,782 | ) | (2,812 | ) | ||||||
| Post-tax impact of adjustment (G+H) | 15,980 | 7,111 | ||||||||
| Adjusted net income (loss) attributable to common shareholders (D-(G+H)) | (6,503 | ) | (2,022 | ) | ||||||
| Weighted average shares outstanding | 8,283 | 8,292 | ||||||||
| Adjusted loss per share | $ | (0.79 | ) | $ | (0.24 | ) | ||||
| Diluted earnings (loss) per share (GAAP)(3) | $ | (2.71 | ) | $ | 0.61 | |||||
| Diluted earnings (loss) per share impact of adjustments | $ | (1.93 | ) | $ | 0.85 | |||||
| . | ||||||||||
| (2) | The Company recorded certain one-time items in each quarter that did not recur in the other period; as a result, the non-GAAP adjustments reflected in each reconciliation may differ between period. | |||||||||
| (3) | Diluted earnings (loss) per share for the current quarter was the same as basic earnings (loss) per share because the net loss makes potential common stock equivalents anti-dilutive. | |||||||||
Graphs accompanying this announcement are available at:
https://www.globenewswire.com/NewsRoom/AttachmentNg/008e5655-05bf-409b-9a4e-4b22aabb0ba8
https://www.globenewswire.com/NewsRoom/AttachmentNg/be6efe52-2d81-4d34-a1f9-57d9bec9c864
![]()
